 AMINA Bank AG
  AMINA UK
  AMINA Hong Kong
  AMINA EU
 Over the weekend, coordinated U.S. and Israeli strikes inside Iran escalated into the most serious regional confrontation in decades. The operation targeted nuclear facilities, military command centers and senior leadership infrastructure, including the reported killing of Iran’s Supreme Leader Ayatollah Ali Khamenei. Within hours, retaliatory missile and drone attacks were launched against Israel and multiple U.S. bases across the Gulf.
Markets opened on Monday facing an abrupt geopolitical repricing. Oil surged, gold climbed, equities fell, and the rate-cut narrative for 2026 was suddenly under threat. In this edition of the Crypto Market Monitor, we assess the immediate market impact across asset classes and set out three strategic scenarios for what comes next.
Oil Markets Reacted Immediately
Oil markets responded first. Brent crude surged more than 13 percent in early trading, briefly touching 82 dollars per barrel after settling near 73 dollars on Friday. U.S. West Texas Intermediate rose toward 72 dollars, marking a double-digit percentage gain within hours.
The move reflects growing concern over a potential supply shock. The Strait of Hormuz carries roughly 20 percent of global oil supply, 26 percent of liquefied natural gas flows and more than one fifth of refined petroleum products. Even limited disruption materially alters shipping costs, insurance premia and refinery margins.
By Sunday evening, tanker traffic through the Strait of Hormuz had reportedly fallen sharply, with several major shipping companies suspending transit. More than one hundred freight vessels were stalled or rerouted, intensifying supply uncertainty.
OPEC+ signaled an additional 206,000 barrels per day of output. However, analysts noted that alternative pipeline routes in the region can absorb only 5 to 7 million barrels per day, leaving a significant volume exposed if the Strait of Hormuz remains constrained.
Traders who had been modelling oil in the mid-60 dollar range are now reassessing scenarios in the 80 to 90 dollar range. Sustained disruption could push prices toward triple digits, particularly if physical flows are interrupted rather than merely delayed.
A sustained 10 dollar increase in crude typically translates into approximately 25 cents per gallon at the pump over time. Energy pricing therefore becomes central to inflation expectations in the weeks ahead.
Figure 1: Brent Crude and US Crude Up By 10% Each
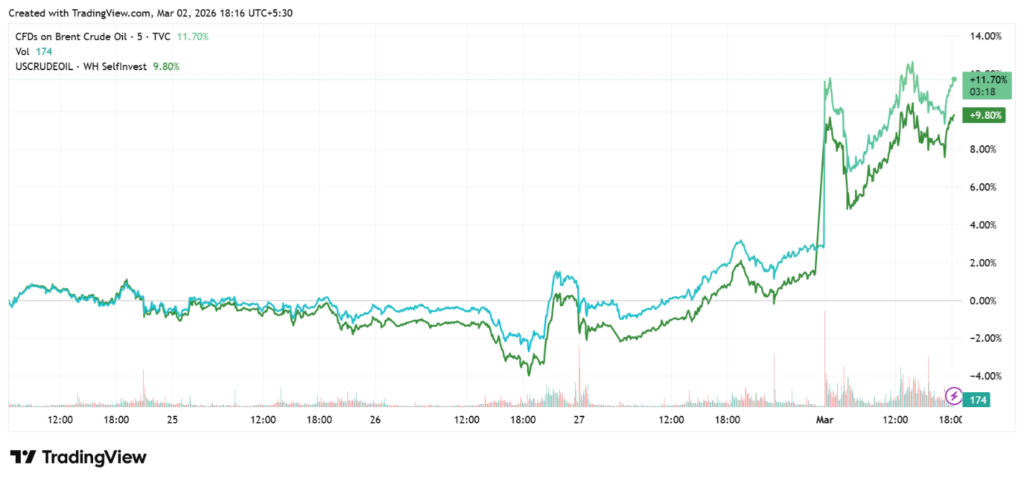
Source: TradingView (As on 2nd March 2026)
Gold Reasserts Its Crisis Role
Gold responded in line with historical crisis behaviour, climbing approximately 2 to 3 percent toward 5,390 dollars per ounce and testing resistance levels near 5,400 dollars. Several major banks reiterated upside targets in the 5,500 to 6,000 dollar range should hostilities intensify.
Tokenised gold instruments mirrored the move, while physical retail pricing in the Gulf region rose sharply in a single session.
Physical flows through Dubai’s bullion trading hub were reportedly disrupted as airspace restrictions affected cargo transport. This introduced an additional layer of tightness in physical markets beyond futures positioning.
The broader message is consistent with previous geopolitical shocks. Investors increase allocations to hard assets when visibility deteriorates and when energy risk threatens to reaccelerate inflation.
Figure 2: Gold Sees Growth By 3% and US Dollar By 0.73% In Last 5 Days
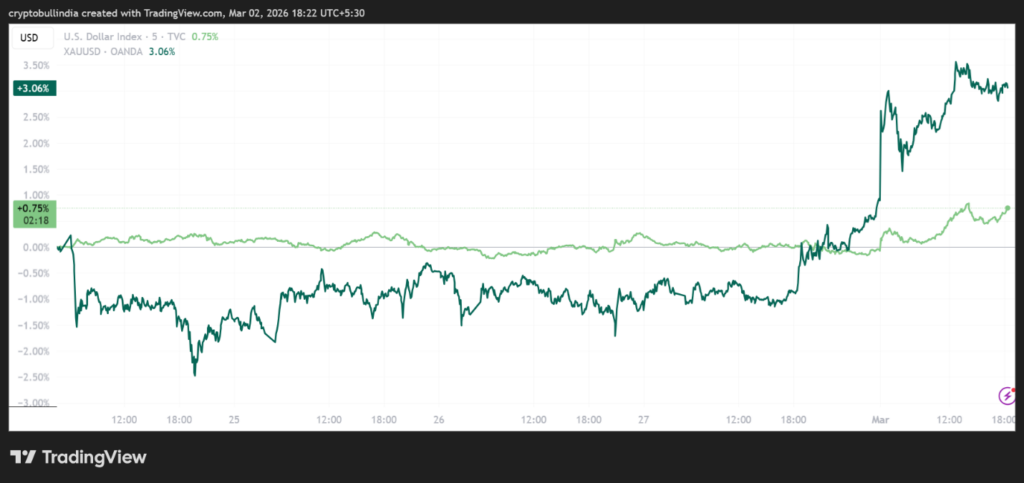
Source: TradingView (As on 2nd March 2026)
Equities Reflect Broad Risk Reduction
Equity markets absorbed the news through a broad risk-off rotation. U.S. futures pointed sharply lower at the open, with the Dow indicating a decline of roughly 600 points, the S&P 500 down around 1.4 percent and the Nasdaq close to 2 percent weaker.
Asian markets fell between 1.6 and 2.5 percent, while Gulf markets declined more sharply as regional risk became immediate. Saudi Arabia’s TASI index dropped over 4 percent following reports of strikes near Riyadh.
Defensive sectors such as energy and utilities outperformed. High-valuation technology and AI-linked equities experienced deeper drawdowns, reflecting sensitivity to liquidity conditions and discount-rate expectations.
The pattern suggests positioning adjustments rather than systemic stress, though volatility remains elevated.
Figure 3: Global Equities Trade Lower as Risk-Off Sentiments Grew
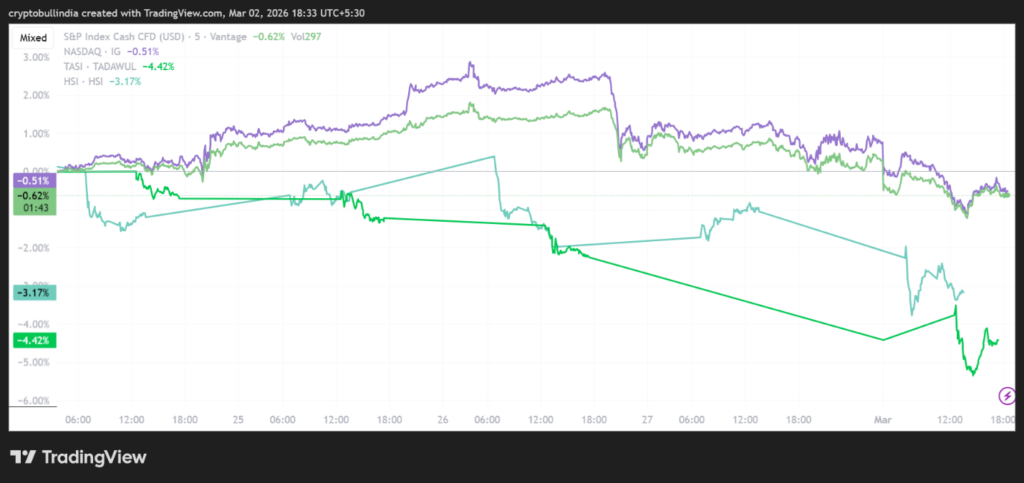
Source: TradingView (As on 2nd March 2026)
Crypto Trades as a High-Beta Risk Asset
Crypto markets, which operate continuously, provided an early signal of investor psychology. Bitcoin declined from the high 60,000 dollar range toward 63,000 before stabilising near 66,000. Ether fell approximately 5 to 6 percent toward 1,800 dollars. Roughly 128 billion dollars was erased from aggregate crypto market capitalisation during the initial move.
The episode reinforced a recurring pattern. During acute geopolitical stress, digital assets initially trade as high-beta risk instruments rather than safe havens.
However, stabilisation within hours suggests that liquidity conditions remain orderly. On-chain data did not indicate forced deleveraging comparable to prior systemic crypto episodes.
For now, crypto appears to be responding primarily to macro risk repricing rather than idiosyncratic sector weakness.
Figure 4: Crypto Traces Lower but Has Stabilised on Monday
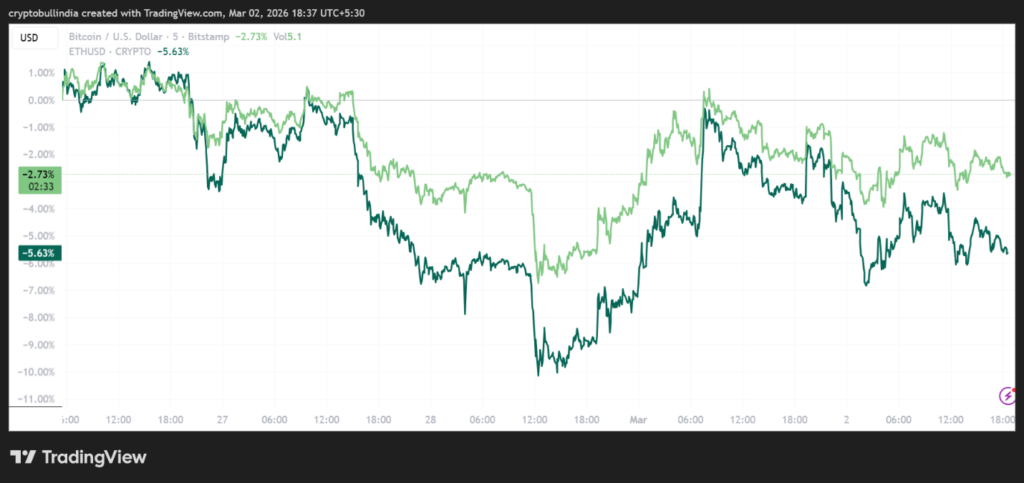
Source: TradingView (As on 2nd March 2026)
Inflation and Policy Implications
Energy shocks transmit rapidly through the real economy. Transport costs rise, fertiliser prices increase, airlines hedge fuel at higher levels and consumers face rising petrol prices.
Economists estimate that sustained oil above 90 dollars per barrel could add approximately 0.6 to 0.7 percentage points to global inflation. Such a development would materially challenge the prevailing rate-cut narrative for 2026.
Markets had been positioned for gradual monetary easing. If energy-driven inflation persists, central banks may need to reconsider the pace or timing of policy normalisation.
Emerging markets that import the majority of their energy face particular pressure through weaker trade balances and currency depreciation. Energy exporters benefit from revenue gains but carry heightened geopolitical risk exposure.
For institutional allocators, the immediate question is not whether inflation re-accelerates. It’s how quickly. Duration-sensitive fixed income positions, rate-cut-dependent equity valuations, and emerging market currency exposures all face a materially different risk environment if oil remains elevated through the second quarter.
Strategic Scenarios
Markets are currently attempting to price an unusually wide distribution of outcomes. The three scenarios below are intended to help institutional allocators frame positioning decisions across that distribution.
- Contained Conflict
Hostilities remain limited and diplomatic channels reopen. Oil reprices lower compared to current levels (WTI 73, Brent 80). Risk assets recover gradually as the geopolitical risk premium fades. - Prolonged Hormuz Disruption
Shipping constraints persist for several weeks without full regional escalation. Oil trades above current levels. Inflation expectations move modestly higher and rate cuts are delayed rather than cancelled. - Regional Escalation
Conflict expands beyond current theatres and supply risks become more structural. Oil prices further increase. Equities correct more sharply, while gold and dollar liquidity remain strongly bid.
Conclusion
The distinguishing feature of this episode is scale and simultaneity. Strikes on leadership targets, immediate cross-border retaliation and disruption to a major global energy chokepoint represent a convergence of military and economic risk rarely observed in modern markets.
Markets do not require immediate de-escalation to stabilise, but they do require visibility. Until clearer signaling emerges, volatility across commodities, currencies, equities and digital assets is likely to remain elevated.
The coming days will hinge on oil price stability, tanker traffic flows and whether diplomatic backchannels begin to offset military escalation. For now, global markets are repricing risk in real time.
Disclaimer – Research and Educational Content
This document has been prepared by AMINA Bank AG (“AMINA”). AMINA is a Swiss licensed bank and securities dealer with its head office and legal domicile in Switzerland. It is authorized and regulated by the Swiss Financial Market Supervisory Authority (“FINMA”).
This document is published solely for educational purposes; it is not an advertisement nor a solicitation or an offer to buy or sell any financial investment or to participate in any particular investment strategy. This document is for publication only on AMINA website, blog, and AMINA social media accounts as permitted by applicable law. It is not directed to, or intended for distribution to or use by, any person or entity who is a citizen or resident of or located in any locality, state, country or other jurisdiction where such distribution, publication, availability or use would be contrary to law or regulation or would subject AMINA to any registration or licensing requirement within such jurisdiction.
Research will initiate, update and cease coverage solely at the discretion of AMINA. This document is based on various sources, incl. AMINA ones. In preparing this document, AMINA may have made limited use of artificial intelligence–enabled tools to assist with research, summarisation, and drafting, with all content subject to human review and validation.
No representation or warranty, either express or implied, is provided in relation to the accuracy, completeness or reliability of the information contained in this document, except with respect to information concerning AMINA. The information is not intended to be a complete statement or summary of the subjects alluded to in the document, whereas general information, financial investments, markets or developments. AMINA does not undertake to update or keep current information. Any statements contained in this document attributed to a third party represent AMINA’s interpretation of the data, information and/or opinions provided by that third party either publicly or through a subscription service, and such use and interpretation have not been reviewed by the third party.
Any formulas, equations, or prices stated in this document are for informational or explanatory purposes only and do not represent valuations for individual investments. There is no representation that any transaction can or could have been affected at those formulas, equations, or prices, and any formula(s), equation(s), or price(s) do not necessarily reflect AMINA’s internal books and records or theoretical model-based valuations and may be based on certain assumptions. Different assumptions by AMINA or any other source may yield substantially different results.
Nothing in this document constitutes a representation that any investment strategy or investment is suitable or appropriate to an investor’s individual circumstances or otherwise constitutes a personal recommendation. Investments involve risks, and investors should exercise prudence and their own judgment in making their investment decisions. Financial investments described in the document may not be eligible for sale in all jurisdictions or to certain categories of investors. Certain services and products are subject to legal restrictions and cannot be offered on an unrestricted basis to certain investors. Recipients are therefore asked to consult the restrictions relating to investments, products or services for further information. Furthermore, recipients may consult their legal/tax advisors should they require any clarifications.
At any time, investment decisions (including, among others, deposit, buy, sell or hold investments) made by AMINA and its employees may differ from or be contrary to the opinions expressed in AMINA research publications.
This document may not be reproduced, or copies circulated without prior authority of AMINA. Unless otherwise agreed in writing, AMINA expressly prohibits the distribution and transfer of this document to third parties for any reason. AMINA accepts no liability whatsoever for any claims or lawsuits from any third parties arising from the use or distribution of this document.
©2026 AMINA, Kolinplatz 15, 6300 Zug