 AMINA Bank AG
  AMINA UK
  AMINA Hong Kong
  AMINA EU
 Executive Summary
Macroeconomic headwinds weighed heavily on bitcoin and the whole cryptoverse in January. According to the AMINAX®Index, an index made of a selection of blue-chip cryptocurrencies, the crypto market dropped by 26% last month. Equities also fell, leading to an increase in bitcoin’s correlation with risk assets.
The last time the Fed increased interest rate in 2015-18, the impact on equity was short-lived as the bull run resumed.
Bitcoin’s social and on-chain trends are recovering with the accumulation from whales.Valuation metrics show that bitcoin, litecoin and ether are attractive, close to their yearly lows.
Despite the market correction, NFT volumes returned to Ethereum, with January 2022 volume set a new high. As a result of market volatility and NFT mania, Ethereum inflation remained low as demand for block space was elevated.
Platform chains had an eventful month with the first Polkadot parachains listed and the first decentralised application on Cardano. Traction continues to improve for these chains.
The decentralised finance (DeFi) ecosystem also took a hit as total value locked declined in the wake of liquidations of user loans. Given the rise of alternate platform chains, most blue-chip DeFi projects are taking a multi-chain approach to boost user growth and revenue.
Table 1: Price performance in USD of the assets in coverage universe as of 29 January 2022

Introduction
In January, the crypto market continued to contract. The price of crypto assets fell sharply mid-month following a selloff in equity markets but recovered somehow as the month ended. Macroeconomic headwinds were the primary reason for the fall as expectations adjusted to a rising interest rate regime.
In this edition of the Digital Investor, we focus on bitcoin as it is the de facto leader and sets the pace for the entire crypto market. We explore it through multiple points of view. First, we look at it in its broader macroeconomic environment to understand how interest rates and equities affect it. Then we analyse the trends in regulation and adoption for crypto. After that, we analyse the social and on-chain trends to understand the current demand. Finally, we also cover other crypto assets to understand their micro-environments.
Bitcoin
Macro
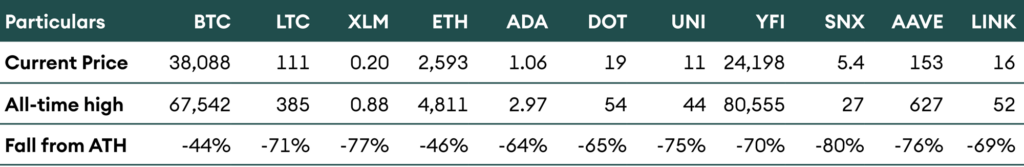
Bitcoin price peaked in early November last year when US inflation passed the psychological 6% mark for the first time since the early 1980s. The thesis that bitcoin is an “inflation hedge” didn’t pass this test. Bitcoin has dragged the entire crypto market in its wake. As table 2 summarises, the selloff is broad and significant.
While bitcoin and ether prices declined by 44% and 46% respectively from their all-time highs, they did comparatively better than all the other coins in the table. It is well established that the big cryptocurrencies are less impacted during a market correction.
Table 2: Fall from all-time highs for various crypto assets
The November inflation data triggered a fundamental reassessment of the US monetary policy. The yield curve has started to adjust to this new reality with the short end of the curve pricing rate hikes. In this rising interest rate regime, growth assets tend to underperform value assets as their projected cashflows are further in the future and disproportionately affected by a higher discount rate. This can also be seen with a sharper fall in tech-heavy NASDAQ 100 than the S&P 500. While bitcoin is not technically a growth asset, it is a similar technology play, and its price has reacted negatively to the expectation of a conservative monetary policy.
More simply, non-yielding assets lose some of their appeals in a rising yield environment. As bitcoin is comparable to cash in this sense, the reaction makes sense. However, it is surprising that Proof-of-Stake assets that offer attractive yields have been hit indiscriminately.
In the last interest rate hiking cycle between 2015 and 2018, the Fed hiked from 0.25% to 2.5% for the first time since the Great Financial Crisis. In December 2015, when the first hike occurred, inflation was not the reason; it was that “growth had stabilised”. After this first-rate hike, the stock market corrected initially as expectations adjusted. However, it soon recovered, and the bull run continued for more than 2.5 years till September 2018, even as interest rates increased six more times after 2015. The stock market struggled for one year from September 2018 to August 2019 on the back of low growth, but the Fed stepped in to support growth with new rate cuts.
Figure 1: Historical relationship between the NASDAQ 100 and the United States Federal funds rate

Interest rate increases do not necessarily need to hurt a long time. After an initial period of adjustment in expectations, the stock market yielded strong positive returns even as the Fed hiked rates on multiple occasions. Higher interest rates, in turn, gave the Fed room to cut rates when needed to support growth at a later stage.
A significant difference between the 2015-2018 cycle and the one likely to start this year is the reason for the hiking. This cycle is about inflation.Currently, it stands at 7%, the highest it has been in 30 years. However, we expect it to play out similarly to 2015-18, where the market recovers after a period of adjustment in expectations.
Financial conditions are still very loose. With 7% inflation and the Fed Fund rate at 1% at the end of the year, the real rate is -6%, unlikely to slow the economy and limit inflation. We need to remember that monetary conditions depend on many factors, including the Fed balance sheet expansion and the equity market.
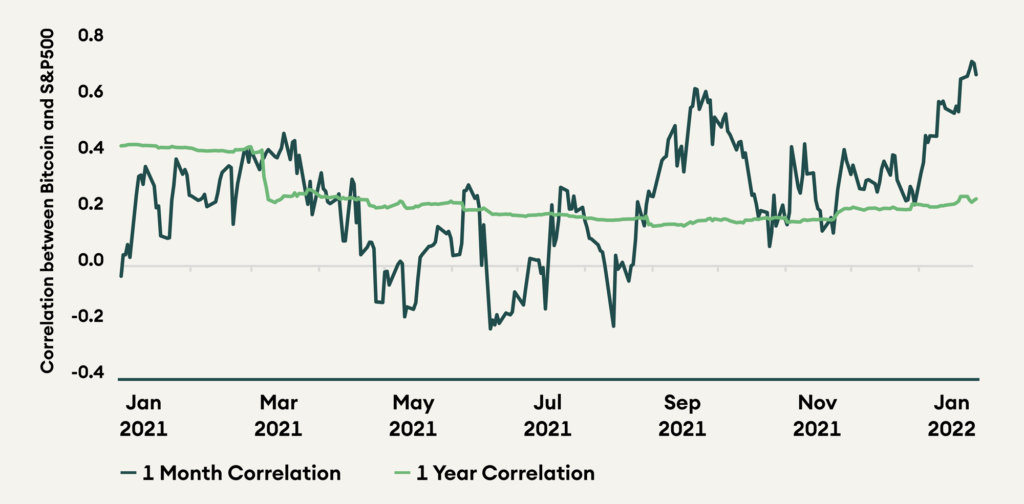
As expectations for crypto and equity have adjusted similarly, the monthly correlation between Bitcoin and S&P 500 is now at a yearly high of ~0.7. Both markets have suffered as investors revised their expectations amid rate hikes and a tighter monetary policy over the last month.
Figure 2: Bitcoin and S&P 500 correlation is the highest it has been since 2021
Regulation and politics
Beyond macro, regulation and adoption have also impacted the crypto markets. Regulation has been a mixed bag with the Biden administration reportedly preparing an executive order to regulate bitcoin and crypto-assets “as a matter of national security”. The Securities and Exchange Commission also maintained its negative stance on a spot-based Bitcoin ETF and rejected multiple applications in January, including one by Fidelity. The SEC is also considering expanding its definition of exchanges which may impact crypto exchanges like Uniswap and block explorers like Etherscan.
Russia flip-flopped on crypto with its central bank calling for a complete ban on crypto trading, mining, and payments. However, the Russian president, Vladimir Putin, recognised the “competitive advantage” Russia enjoys in crypto mining with surplus electricity and well-trained professionals. The Mayor of the Brazilian city, Rio de Janeiro, has decided to allocate 1% of the city’s treasury to bitcoin. There is also an expectation that at least another sovereign country will follow El Salvador’s lead and adopt bitcoin as legal tender in 2022.
On the adoption front, positive news flow continued. Google Cloud is building a dedicated “Digital Assets Team“, and its payments division “pays a lot of attention” to crypto. Other prominent American companies are also exploring crypto, with the most interest in gaming, NFTs and metaverse. Giants like Apple, Microsoft, Walmart, and Meta (Facebook) are all in various stages of exploration and investment.
Social and On-chain data
Historically, Google search interest for Bitcoin has moved in tandem with its price. However, a deviation emerged in the second bull run of 2021, where search interest remained low while price hit an all-time high. This deviation coincides with the observation that the second part of the bull run was supported by the return of experienced buyers more than by new one.
Figure 3: Bitcoin search interest remained low in the second half of 2021 even with surging prices

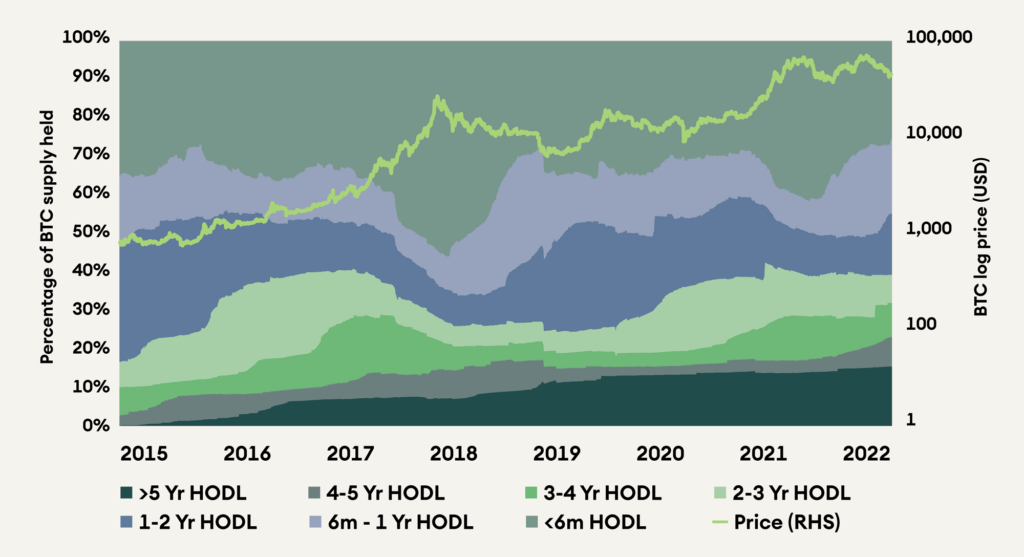
The return of experienced buyers is confirmed from the pattern of the HODL wave as well. The number of new holders (less than six months) is usually positively correlated with the price, with new users peaking at the same time as price. However, in the second half of 2021, this relationship broke down. We should note that new users participating in other ecosystems like Ethereum and other platform chains behave differently.
Figure 4: Bitcoin HODL wave shows limited adoption by new users in the second half of 2021
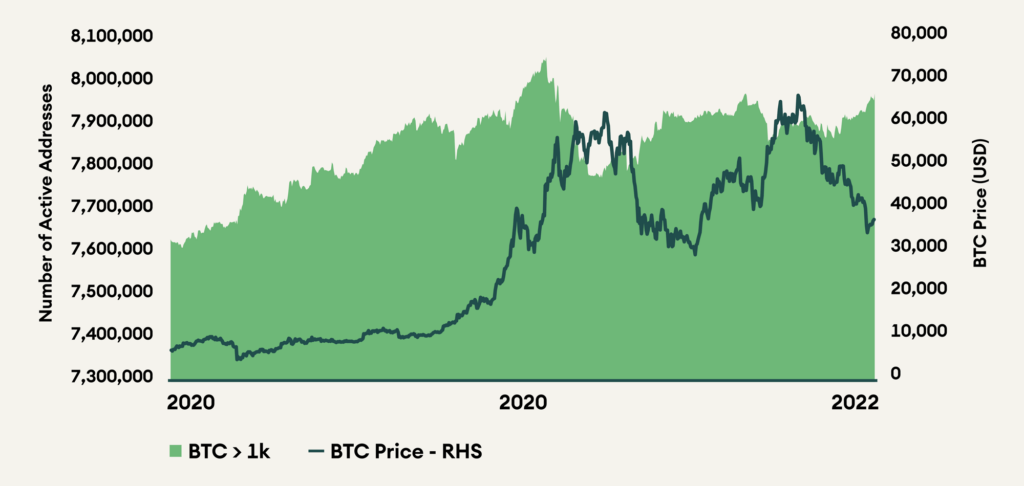
Finally, another trend is the large bitcoin wallets or “whales” holding pattern. Whales seem to have sold into the previous highs in 2021 but are again accumulating as prices have fallen. This augurs well for the price as whale buying usually precedes a bull run, and their selling halts it.
Figure 5: Large wallets have begun accumulating BTC again
Valuation
The network value to transaction value (NVT) ratio is a fundamental valuation tool to compare payment chains. It compares the market capitalisation to the value settled on-chain. A low NVT ratio signifies a cheaper valuation and vice versa. NVT for BTC hit a 1-year low in January and currently trades at 44. LTC and ETH also trade at reasonable valuations of 31 and 34. XLM continues to be expensive at an NVT of 169.
Figure 6: BTC, ETH, and LTC are trading at cheap NVT ratios

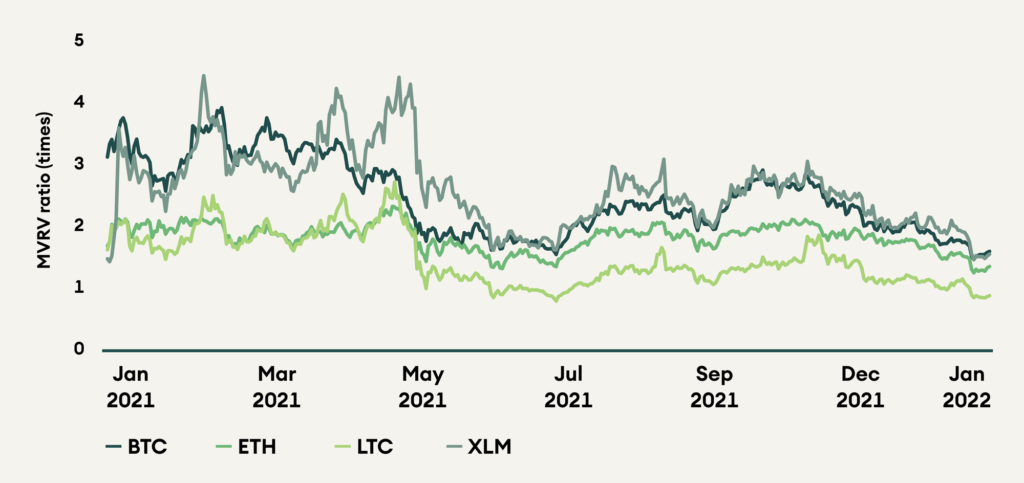
Market value to realised value ratio (MVRV) shows the degree of profitability of the holders of payment coins. It compares the current market capitalisation to the sum of the value of all native coins when they last moved on-chain. MVRV ratio is a behavioural indicator with a high MVRV ratio signifying that holders enjoy a higher profit and are likelier to sell. With depressed prices, it is no surprise that MVRV ratios for all chains also indicate a low degree of profitability for the holders. Holders of LTC are in losses on aggregate with an MVRV ratio of 0.87. Ethereum hit a yearly low for its MVRV and currently trades at 1.35. It is followed by XLM and BTC at 1.55 and 1.59, respectively.
Figure 7: Low MVRV ratios for all chains show a low degree of profitability for the holders
Our analysis of the actual selloff shows that changes in monetary policy expectations have impacted the cryptoverse more than they did before. Bitcoin has behaved similarly to risky assets as its prices dropped. However, on-chain data shows that supports remain strong. Experienced buyers are back in the game, and whales are piling up. As the monetary conditions seem priced and the on-chain data is supportive, including attractive valuation, we think that cryptos should be supported going forward.
Ethereum
An essential attribute for a platform chain is resilience during periods of high demand. Ethereum’s network never halted throughout its history, and it remained robust during January as it faced high demand during market volatility. Several other blockchains had degraded performance, including Solana and Polygon. Please refer to the Crypto Market Monitor on this topic for more information.
Ethereum has conflicting forced acting on it. While demand is high and tokenomics are improving with EIP-1559 and the transition to proof-of-stake, gas prices remain high, and throughput remains low. Ethereum is trying to address these through rollups, but their adoption remains slow. The merge to Ethereum 2.0 also remains a crucial event to look out for in 2022.
NFT volumes surged in January as adoption by celebrities and corporates grew. OpenSea, the Ethereum-based NFT marketplace, saw 37% and 27% monthly growth in December and January, respectively, after four months of declining volumes. January also set a new all-time high for trading volume with USD 4.1 billion traded, eclipsing the August 2021 volume of USD 3.4 billion.
Figure 8: January 2022 set a new all-time high for NFT volumes on OpenSea

With a high degree of on-chain activity, gas prices remained high in January and consequently led to a high amount of ETH burnt because of EIP-1559. 30-day average inflation was 0.6% for January, an 86% reduction in net issuance compared to pre-EIP-1559 inflation of 4.5%.
Figure 9: January saw a reduction in net issuance as market volatility and NFT mania increased demand for block space

Alternative Platform Chains
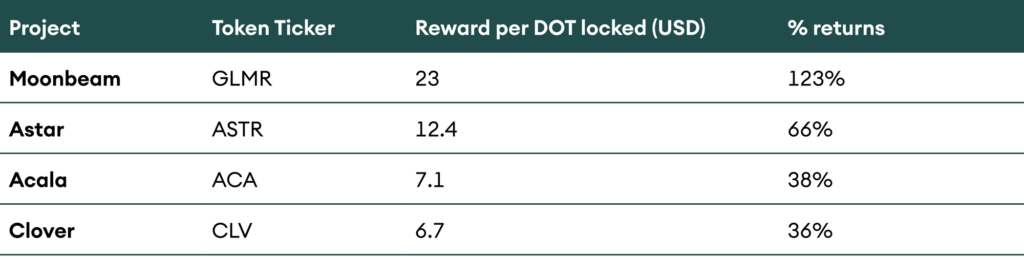
Polkadot and Cardano had significant developments in January. For Polkadot, four parachains completed their token reward distribution. Parachains reward the lenders who support their auction bid by issuing their tokens. So far, Moonbeam, Acala, Astar, and Clover Finance have completed their token launch. With high returns, investors are likely to participate in the upcoming crowdloans, locking up more DOT. Currently, 118 million DOT is locked in parachain auctions, representing 12% supply.
Table 3: Returns for participating in crowdloans
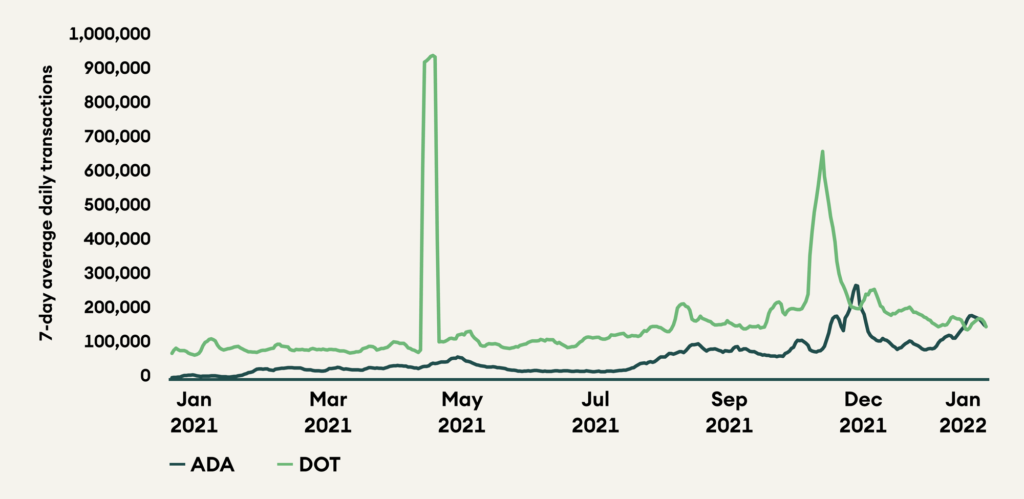
Cardano’s first decentralised application went live with the launch of the decentralised exchange SundaeSwap. While the launch faced severe congestion, with transactions taking days to clear, it is still a big step forward for smart contract growth and adoption for Cardano. A decentralised exchange is an essential financial primitive that allows for the free trade of any coins on the network. DeFi is now officially on Cardano and boasts of USD 73 million in total value locked! On the back of this launch, transaction activity for Cardano has spiked. Average daily transactions for Cardano were up by 40% for the month to 143,000. Polkadot saw a 21% degrowth in transaction volume over the same period, with average daily transactions now at 166,000 for January 2022.
Figure 10: Cardano and Polkadot continue to support a growing number of transactions
Decentralised Finance (DeFi)
Market correction since November 2021 has affected the decentralised finance ecosystem as well. Total value locked (TVL) has dropped by approximately 30% since its all-time high of USD 112 billion on 9 November 2021. Although the total number of users has been growing steadily over the past year, the lack of breakthrough innovation coupled with the emergence of low-cost alternate platform chains has halted DeFi’s exponential growth trajectory. It is worth noting that DeFi token as a whole did not perform well last year, even before the bitcoin peaked in November. The hype DeFi created in 2020 faded away in early 2021 to be replaced by NFTs and the metaverse. The ecosystem can mainly be categorised into lending, decentralised exchange (DEXes), asset management, and derivatives projects. Lending protocols control most TVL, followed by DEXes and asset management tools. With the emergence of multiple new smart contract blockchains, successful projects are taking a multi-chain approach to enhance user growth for long term sustainability.
Figure 11: DeFi TVL has been declining since November 2021

Since the launch of Uniswap v3 on Polygon, users have saved approximately USD 10 million in fees. Still, most of Uniswap’s TVL (98%) resides on Ethereum, and Arbitrum, Optimism, and Polygon contribute a minimal amount. The governance decision to enable one basis point fee tier helped drive stablecoin trading activity on the DEX, resulting in the highest 24hr volume of ETH/USD spot trading of USD 1.25 billion on the 20 January 2022, exceeding that of big, centralised exchanges like Binance, Coinbase, and FTX. Further, Uniswap released the deployment script and documentation outlining how to deploy Uniswap protocol v3 to other chains, along with a proposal for simplifying the community governance process for efficient execution of future cross-chain proposals. This shall help the project to go multi-chain faster, thus increasing user activity and revenue.
Figure 12: Uniswap continues to be the leading DEX on monthly volumes over the past year

The data oracle, Chainlink, is innovating to provide more accurate data and tools to smart contracts developers across chains. The co-founder, Sergey Nazarov, recently talked about the Cross-Chain Interoperability Protocol (CCIP) that will enable developers to build next-generation smart contracts leveraging the advantage of multiple blockchain networks along with off-chain services. Synthetix announced a month-long incentive program for WETH/SNX liquidity provider on Optimism of 50,000 SNX to enhance volume growth. Aave v3 protocol is now live across seven different testnets. This promises to provide more efficiency for cross-chain functionalities. Yearn Finance also announced seven new Yearn vaults on Ethereum and seven new Yearn vaults on Fantom. Following the almost 45% drop in the market from all-time high levels, along with centralised exchange liquidations, Aave also saw liquidations during the same time, amounting to approx. USD 60 million. The multi-chain approach seems to be the only saviour at this point for all major blue-chip DeFi projects, but product and UX innovation will also be needed to be on the path of exponential growth once again.
Figure 13: YFI and AAVE TVL growth has outpaced market cap growth

Conclusion
Bitcoin is the de facto leader of the crypto space and usually sets the pace for the broad market. For this reason, we focussed on Bitcoin in this Digital Investor, exploring it from multiple points of view. First, we explore it in the context of the broader macroeconomic environment to show that changes in monetary policy expectations have dragged down its price. Regulation continues to be an essential battleground that will play a growing part in the narrative as governments look to regulate the ecosystem. However, adoption trends for crypto remain strong as multiple large companies start unveiling their crypto and metaverse strategy, including Google, Microsoft, and Walmart. Analysing the social and on-chain trends, we note that there has been a low amount of new user activity, specifically for bitcoin. However, whale buying has recovered and is a positive trend. The NVT and MVRV ratios for all payment coins have depressed with prices, and valuations have become cheap because of the fall in prices. NFT volumes returned to Ethereum, with January 2022 setting a new monthly high. Inflation remained low as demand for block space was elevated because of market volatility and NFT mania. Platform chains continue to see higher traction as the first application and parachains go live for Cardano and Polkadot, respectively, in January 2022. The decentralised finance ecosystem also took a hit last month, losing TVL and triggering liquidations of user loans. Given the rise of alternate platform chains, most blue-chip projects are taking a multi-chain approach to boost user growth and revenue.