 AMINA Bank AG
  AMINA UK
  AMINA Hong Kong
  AMINA EU
 The cryptocurrency market hosts over 10,000 digital assets, a number that was only a fraction of this a year ago. Among them, there are approximately 300 Layer 1 (L1) blockchains and over 100 Layer 2 (L2) networks. With such a vast and rapidly expanding ecosystem, distinguishing between different blockchains – let alone keeping track of all of them – has become increasingly challenging.
Each blockchain offers unique advantages: some optimise for speed, some for cost and others may focus on decentralisation. This diversity, however, can leave the average investor both confused and skeptical – questioning the significance of minor changes in newer blockchains or the viability of older networks that may have yet to see substantial upside in the current cycle.
To bring clarity to this evolving landscape, we present an objective comparison of Layer 1 networks.
Current trends onchain
These independent blockchains operate with their own consensus mechanisms, finality rules, and native tokens, serving as the foundation for decentralised applications. Some of the most prominent L1 networks include Bitcoin, Ethereum, Solana, Avalanche, BNB Chain, and Cardano. Meanwhile, newer entrants like Sui and Aptos were the primary beneficiaries in 2024, rapidly gaining market share. Each of these blockchains sustains a flourishing economy of its own, and by analyzing their on-chain metrics, we can assess their relative competitive standing in the broader crypto landscape.
Economic activity can be measured and compared across most Layer-1 networks, as most major blockchains today support smart contracts that largely compete for similar use cases.
Key metrics such as daily active addresses (DAA), transaction count, stablecoin supply, protocol fees earned, decentralised exchange (DEX) volumes and total value locked (TVL) serve as comparative indicators for assessing relative dominance across smart contract ecosystems. This analytical approach helps gauge how the market is pricing in future activity – or the potential lack thereof – on each chain. The table below provides an overview of the current state of on-chain activity and financial metrics for these networks.
Table 1: Onchain metrics for top Layer-1 blockchains
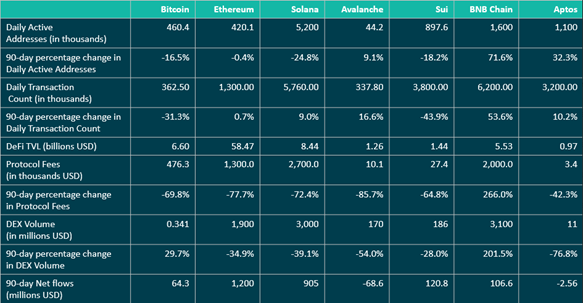 Source: Artemis, DeFi Llama, February 2025
Over the past 90 days, Binance’s BNB Chain has experienced a significant surge in user activity. It recorded the highest percentage growth among major networks in both daily active addresses (71.6%) and daily transaction count (53.6%). Additionally, with a 5.3% increase in total value locked (TVL) over the same period, BNB Chain stands as the only major alternative Layer-1 to register a positive change in this metric. The trend extends to DEX volume as well – BNB Chain saw a staggering 210% increase over the past three months, outperforming its competitors, all of whom recorded declines in the same timeframe.
Notably, this surge in network activity has occurred despite BNB, the chain’s native token, appreciating by only 4.5% during the period. The primary driver behind this uptick has been the rise in memecoin activity. While memecoins have been a major catalyst for Solana this cycle, their impact on BNB Chain has only recently gained momentum. It began with the listing of Test (TST) on the network, but the real breakthrough came when BNB Chain introduced its Memecoin Solution – a plug-and-play guide designed to simplify memecoin launches. This initiative triggered a sharp increase in activity, alongside a price rally in the native tokens of decentralized exchanges such as PancakeSwap and BakerySwap. As of now, PancakeSwap has overtaken Ethereum-based Uniswap and Solana’s Raydium to become the highest-volume DEX in the past 24 hours.
Stablecoin supply
When it comes to on-chain stablecoin market capitalization, Ethereum remains far ahead of its competitors. The total stablecoin market cap on Ethereum currently stands at approximately $122 billion, with Tether’s USDT accounting for 54% of the supply. Solana follows in second place, hosting $11.7 billion in stablecoins – of which Circle’s USDC holds a dominant 72% share.
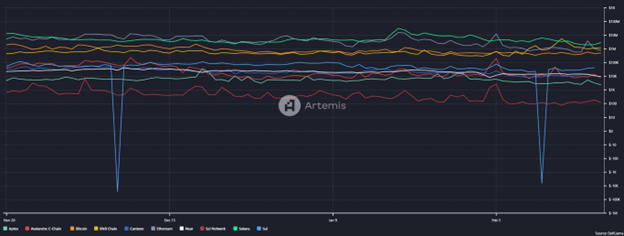
Figure 1: Total stablecoin marketcap on major chains
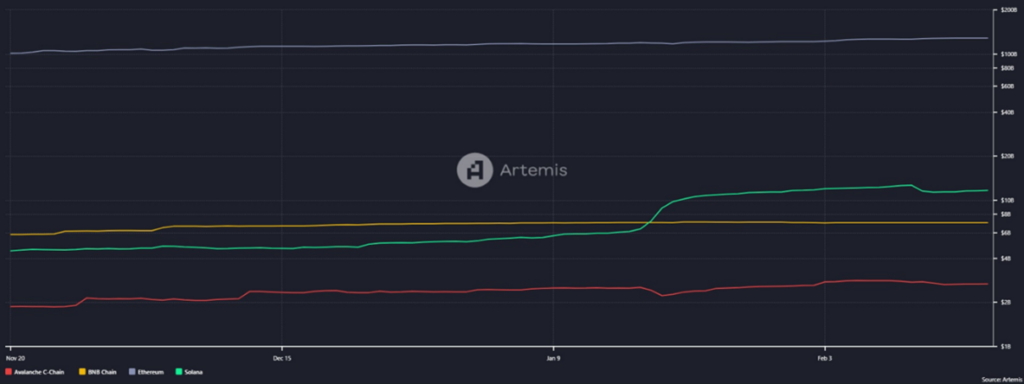 Source: Artemis, February 2025
A significant shift occurred over the past 90 days: for the first time since 2022, Ethereum overtook Tron in USDT supply dominance. While Tron remains a key player as a high-speed, low-fee transactional network, the surge in activity on Ethereum has led to a disproportionately high volume of USDT being minted on the chain. This increase has largely been driven by bullish market conditions, which gained momentum around the time of the recent U.S. elections.
Figure 2: USDT supply on Ethereum overtook that of Tron in Q4 2024
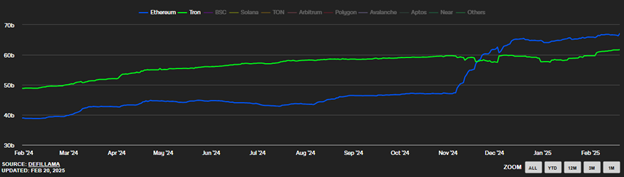 Source: The Block, February 2025
Meanwhile, Solana has recorded the highest percentage increase in stablecoin market cap across all chains in the past three months. A major contributor to this was the sudden spike in stablecoin supply on January 17, coinciding with the launch of the TRUMP memecoin. Although the token has since plummeted by over 76% from its all-time high, the stablecoin liquidity it brought to the network has remained steady. This benefits Solana in the long run by expanding liquidity access and increasing the target addressable market for projects building on the chain.
Net flows
Net flows into and out of a network serve as a key indicator of demand for on-chain services. Among Layer-1 networks, Ethereum leads with $1.2 billion in net inflows over the past 90 days, followed by Solana at $905 million. Meanwhile, on Ethereum, Uniswap remains the top gas consumer, yet the highest number of daily active addresses is associated with Tether transactions.
Figure 3: 90-day net flows by chain
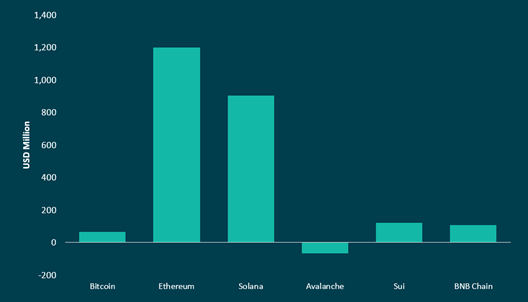 Source: Artemis, AMINA Bank, February 2025
Among newer Layer-1s, Sui has emerged as a standout performer, recording over $120 million in net inflows – outpacing even well-established chains like BNB Chain ($106 million) and Bitcoin ($64 million). The most active dApps on Sui have been DeepBook DEX and BIRDS, a memecoin and GameFi platform. BIRDS experienced a surge in engagement due to its airdrop-to-play model, which rewarded all participating users with free $BIRD tokens. DeepBook, on the other hand, launched its mainnet in October 2024 and has since grown its total value locked (TVL) to $20 million. While initial activity on the DEX was driven by launch hype, its long-term adoption remains to be seen.
Although DeepBook and BIRDS lead in active user engagement, the Wormhole bridge is the top gas consumer on Sui. Additionally, according to Messari, the network’s native token, SUI, ranks among the top three most traded tokens across major blockchains – trailing only ETH and SOL.
Network financials
As providers of finite blockspace, Layer-1 blockchains – along with their validators in Proof-of-Stake (PoS) systems or miners in Proof-of-Work (PoW) systems – are compensated through transaction fees paid by users seeking to have their transactions included on the network. While fee structures vary across different Layer-1s, these fees serve as both an incentive for network participants and a source of revenue for the blockchain itself. Typically, they are paid in the network’s native token, such as BTC, ETH, or SOL.
Given the diverse range of participants across various networks, evaluating transaction count alone does not provide a complete picture. It is equally important to consider average transaction size, as this offers deeper insights into network usage and economic activity.
Figure 4: Layer-1s by Transaction Count and Size
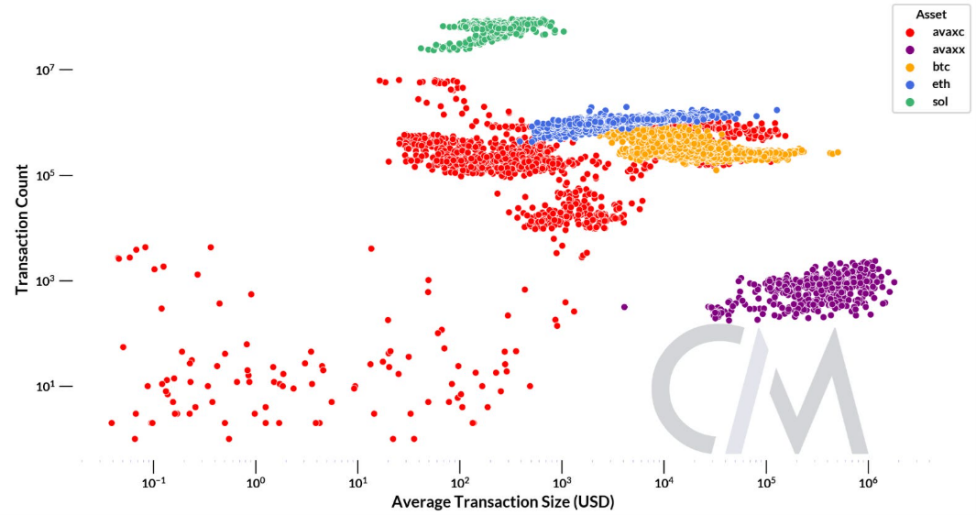 Source: Coinmetrics, September 2024
As observed, low-fee networks like Solana are designed for high-frequency, low-value transactions. Unlike other blockchains, Solana also includes validator vote transactions within blocks; however, these have been excluded here to focus solely on user-driven transactions. In contrast, Bitcoin predominantly facilitates high-value transfers, aligning with its role as a store of value and settlement layer. Ethereum falls between these two extremes, balancing both high-value transfers and frequent, lower-value transactions, reflecting its general-purpose nature. Meanwhile, Avalanche exhibits greater variability, suggesting a more adaptable network suited to diverse use cases.
These differences directly impact fee generation across networks. For instance, while Solana records approximately 53 million daily active addresses – nearly 40 times that of Ethereum (1.3 million) – its total daily fee collection stands at just $2.9 million, only three times that of Ethereum ($777K). This highlights the efficiency of Solana’s low-fee model but also the stark disparity in fee revenue compared to Ethereum.
Figure 5: Fees generated by chain (past 90 days)
 Source: Artemis, February 2025
However, a less encouraging trend is the persistently low activity on networks like Cardano and Avalanche, despite their transaction fees being significantly lower than those on Ethereum and Bitcoin. This raises questions about the level of organic demand and sustained adoption on these chains.
Looking Ahead
Ethereum is the foundational infrastructure layer for most of crypto and DeFi. However, the extent to which ETH accrues value from this role is not as significant as it was in the past. As data costs decline and computational efficiency improves with each cycle, the demand for ETH from both users and Layer 2 (L2) operators has been on a decline but the long term plan that as demand increases, utility and function will replace for the high costs of today, still stands.
Solana rose from the ashes post FTX this cycle and has seen exponential growth, becoming Ethereum’s closest competitor. Additionally, without an L2 ecosystem, the value accrual for SOL is more straightforward than for ETH. Adding to this demand for SOL was also the network’s memecoin culture – arguably the most heated across L1s in crypto this cycle.
But will this memecoin-first culture define Solana’s identity indefinitely? Or will it evolve into a dual-purpose ecosystem – acting as a high-risk, high-reward casino for retail traders while also maturing into a more structured space for institutional participation? The upcoming Firedancer upgrade will enhance network efficiency, making it even more conducive to retail speculation by reducing the load on the Solana client.
Interestingly, what we see today aligns with the original vision of Solana’s founders. Their goal was never to build an institution-first blockchain, it was to build a retail-friendly low-cost general-purpose machine. The major hurdle last cycle was FTX’s centralised control over the ecosystem – something that is no longer a factor. With the implementation of SIMD-0096, validators now earn higher rewards, which could significantly impact Solana’s staking landscape once bull market opportunities diminish. This enhanced yield may also attract mercenary capital away from Ethereum. However, the removal of the burn mechanism presents a challenge – while Solana’s market cap may continue to grow, SOL’s token price could face downward pressure.
So, the million-dollar question – what’s the SOLUNAVAX of this cycle? Solana has already delivered a massive 30x return from its cycle low to its peak, making it one of the biggest trades of this cycle. But what will make the next L1 winner? It usually comes down to a combination of factors – strong user adoption, a shrinking native token supply, growing institutional interest, low fees, high throughput and a thriving community culture that brings in retail users.
There’s no clear front-runner yet, but a few names are making a strong case for themselves. Sui has been on an explosive growth trajectory, with active addresses skyrocketing 83x and protocol revenue climbing 150% in the past year. Aptos is another serious contender, with an 8x jump in active addresses and a 4.5x increase in transaction count. Then there’s Hyperliquid, which has captured retail attention in a big way. Over the last year, it has seen trading volumes surge by 334%, and with the recent launch of HyperEVM—its own Ethereum Virtual Machine—it’s laying the groundwork for a more robust ecosystem.
It’s tough to predict exactly which L1 will take the crown next. The space is evolving at an incredible pace, and every new innovation changes the game. But if history is any guide, the biggest winners will be those that strike the right balance between cutting-edge tech and a strong community. However, away from all the noise, one thing remains certain – Bitcoin was, is, and will always be the king, with an ever-increasing market share in the long run. The real competition lies in who claims what percentage of the rest of the market.
Disclaimer
This document has been prepared by AMINA Bank AG (“AMINA”) in Switzerland. AMINA is a Swiss bank and securities dealer with its head office and legal domicile in Switzerland. It is authorized and regulated by the Swiss Financial Market Supervisory Authority (FINMA).
This document is published solely for educational purposes; it is not an advertisement nor is it a solicitation or an offer to buy or sell any financial investment or to participate in any particular investment strategy. This document is for distribution only under such circumstances as may be permitted by applicable law. It is not directed to, or intended for distribution to or use by, any person or entity who is a citizen or resident of or located in any locality, state, country or other jurisdiction where such distribution, publication, availability or use would be contrary to law or regulation or would subject AMINA to any registration or licensing requirement within such jurisdiction.
No representation or warranty, either express or implied, is provided in relation to the accuracy, completeness or reliability of the information contained in this document, except with respect to information concerning AMINA. The information is not intended to be a complete statement or summary of the financial investments, markets or developments referred to in the document. AMINA does not undertake to update or keep current information. Any statements contained in this document attributed to a third party represent AMINA’s interpretation of the data, information and/or opinions provided by that third party either publicly or through a subscription service, and such use and interpretation have not been reviewed by the third party.
Any prices stated in this document are for information purposes only and do not represent valuations for individual investments. There is no representation that any transaction can or could have been affected at those prices, and any price(s) do not necessarily reflect AMINA’s internal books and records or theoretical model-based valuations and may be based on certain assumptions. Different assumptions by AMINA or any other source may yield substantially different results.
Nothing in this document constitutes a representation that any investment strategy or investment is suitable or appropriate to an investor’s individual circumstances or otherwise constitutes a personal recommendation. Investments involve risks, and investors should exercise prudence and their own judgment in making their investment decisions. Financial investments described in the document may not be eligible for sale in all jurisdictions or to certain categories of investors. Certain services and products are subject to legal restrictions and cannot be offered on an unrestricted basis to certain investors. Recipients are therefore asked to consult the restrictions relating to investments, products or services for further information. Furthermore, recipients may consult their legal/tax advisors should they require any clarifications.
At any time, investment decisions (including whether to buy, sell or hold investments) made by AMINA and its employees may differ from or be contrary to the opinions expressed in AMINA research publications.
This document may not be reproduced, or copies circulated without prior authority of AMINA. Unless otherwise agreed in writing AMINA expressly prohibits the distribution and transfer of this document to third parties for any reason. AMINA accepts no liability whatsoever for any claims or lawsuits from any third parties arising from the use or distribution of this document.
Research will initiate, update and cease coverage solely at the discretion of AMINA. The information contained in this document is based on numerous assumptions. Different assumptions could result in materially different results. AMINA may use research input provided by analysts employed by its affiliate B&B Analytics Private Limited, Mumbai. The analyst(s) responsible for the preparation of this document may interact with trading desk personnel, sales personnel and other parties for the purpose of gathering, applying and interpreting market information. The compensation of the analyst who prepared this document is determined exclusively by AMINA.