 AMINA Bank AG
  AMINA UK
  AMINA Hong Kong
  AMINA EU
 Introduction
Bitcoin recovered significantly in 2023, surging by about +150% year-to-date, from USD 16,600 to 41,600 at the time of writing. Bitcoin is one of the best-performing assets this year.
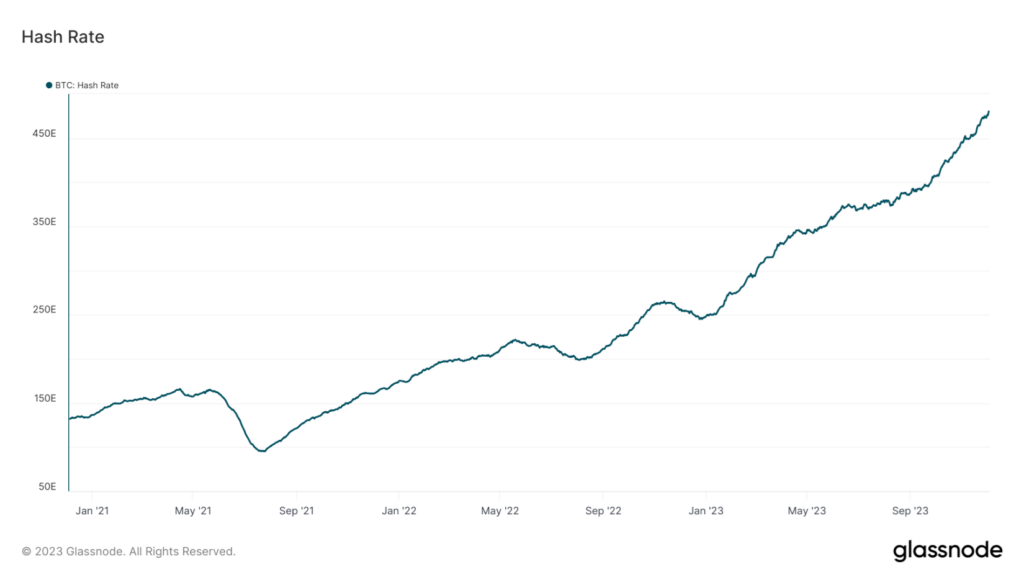
Easing concerns over various macroeconomic risks, deceleration in inflation and the end of central bank hawkish rhetoric all contributed to the turnaround of the crypto market. This turnaround is broad based as market leadership in digital assets has distributed to a wider array of crypto segments. A range of crypto industry fundamentals have improved, for instance Bitcoin’s hash rate — a measure of the total amount of computing power securing the network — reached an all-time high in November as illustrated in figure 1.
Figure 1: Bitcoin Hash Rate
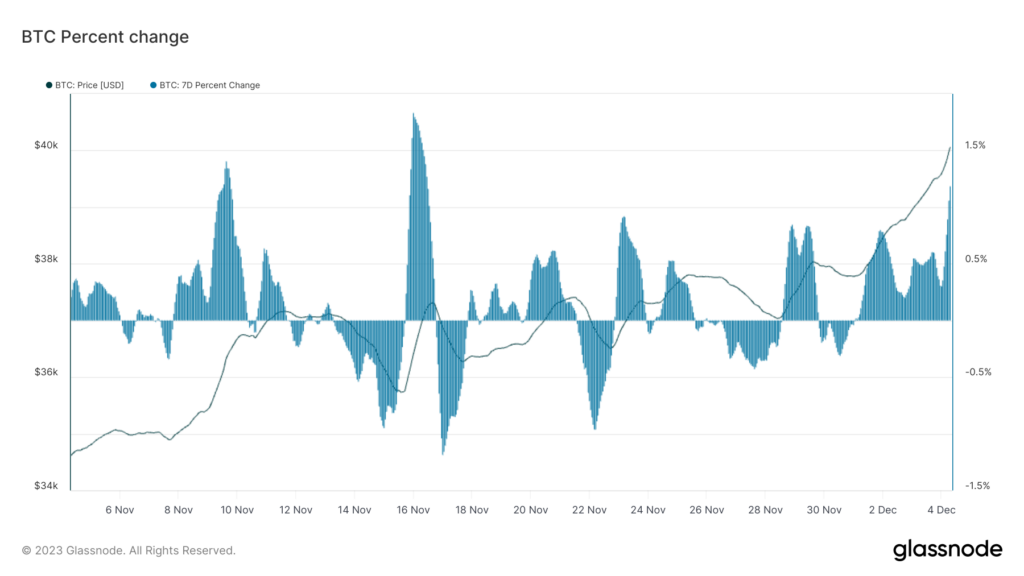
In the past month, financial markets have shown less concern about potential high-impact risks, aiding the recovery of previously lagging assets. For example, positive developments in the Middle East conflict have lessened fears of regional disruption, benefiting assets linked to Israel’s economy. Additionally, long-term U.S. Treasury bonds gained value as the Treasury announced a lower-than-expected increase in borrowing needs.
Figure 2: BTC return on a weekly basis
This month’s edition of the “Digital Investor” is a data digest that focuses on macro and on-chain data of the two dominant cryptocurrencies, Ethereum (ETH) and Bitcoin (BTC). With these two key cryptocurrencies, the report provides insights into the overall health and trajectory of the digital asset space in the context of broader economic trends.
The On-Chain Fundamentals
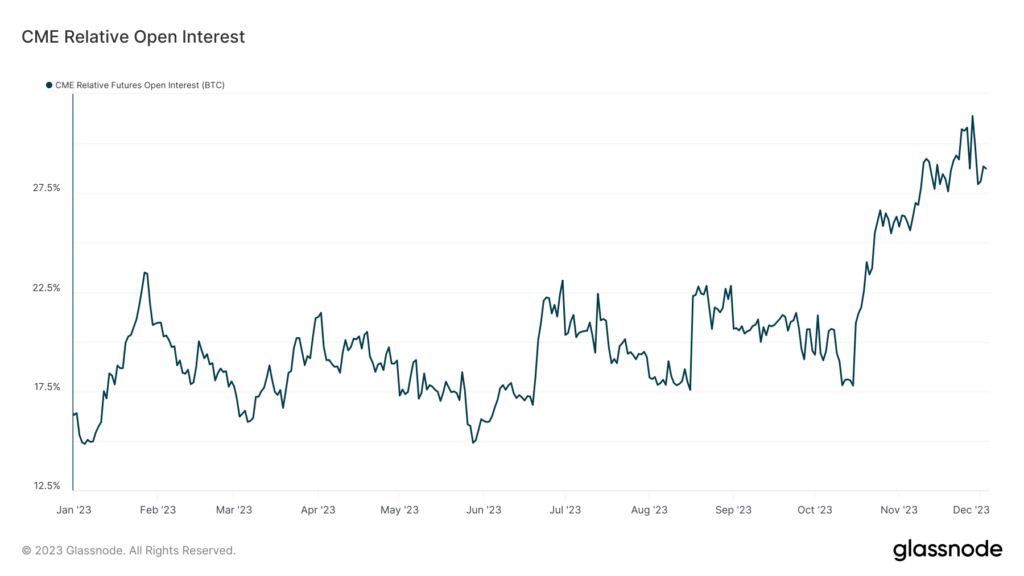
The SEC’s non-appeal of a court order to review Grayscale’s Bitcoin ETF application signals a potential shift in stance, fuelling optimism for Spot BTC ETF approvals. This optimism reflects in the Bitcoin futures market, where CME’s open interest in Bitcoin futures reached a record 29.2% (see figure 3), indicating growing institutional involvement and integration of digital assets in large financial portfolios.
Figure 3: Optimism in the Futures Market
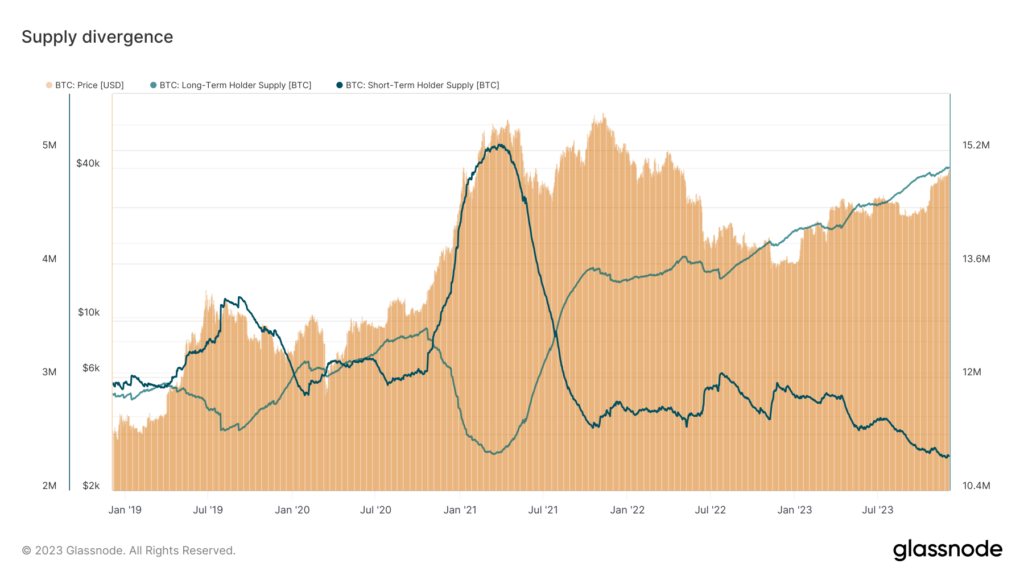
The behavior of BTC holders also suggest optimism. There is a notable divergence, between Long-Term Holder (LTH) supply approaching an all-time high and Short-Term Holder (STH) supply at a near all-time low. This indicates a tightening in Bitcoin’s availability, as long-term investors are hesitant to sell. Historically, LTHs begin distributing their holdings as market prices reach new highs, a trend seen in the 2021 bull run. Figure 4 shows developments in LTH and STH supplies. The divergence hit new highs, highlighting the scarcity in Bitcoin’s market supply. The consequence of this state of the market, is upward pressure on prices, higher volatility, and lower liquidity.
Figure 4: Divergence in long term vs short term BTC holders’ behavior
BTC is still a leading indicator!
In 2023, Bitcoin’s dominance in the digital asset market has been on the rise, currently accounting for over 53% of the market valuation. This increase marks a significant recovery from its cyclical low of 38% at the end of 2022. In contrast, Ethereum, other altcoins, and stablecoins have all experienced a relative decline in their market dominance throughout the year.
To further illustrate this trend, comparing the year-to-date (YTD) increases in market capitalization between Bitcoin and the aggregate altcoin market (excluding stablecoins) is insightful. Bitcoin’s market cap surged by 140% in 2023, while altcoins’ market capitalization only increased half of it, by 69% (see chart below).
Figure 5: BTC dominance has increased this year
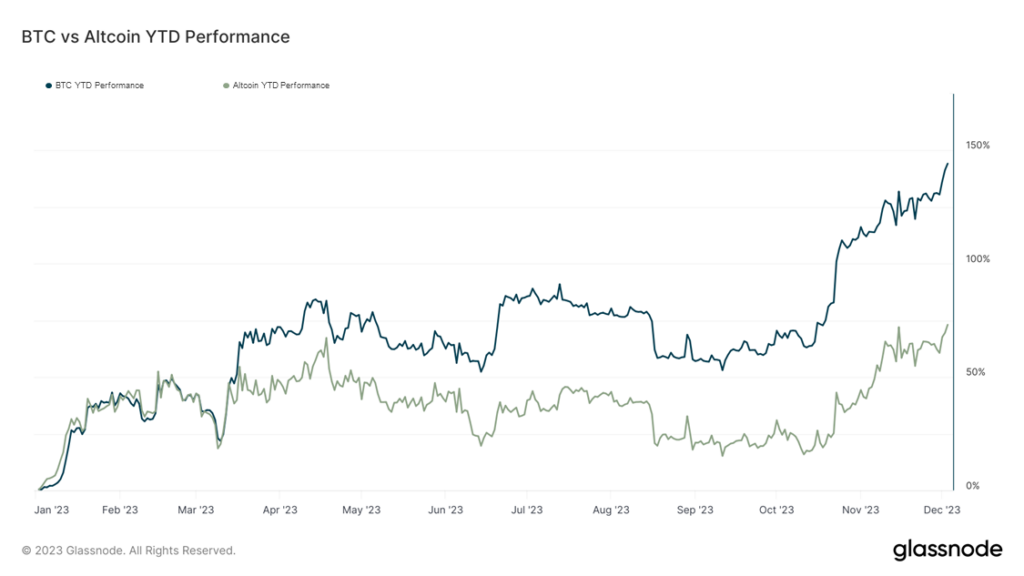
This situation points to a distinctive market dynamic: while altcoins are outperforming most of the traditional assets and gold, they are lagging Bitcoin’s performance. This trend underscores Bitcoin’s growing prominence and influence within the cryptocurrency market and highlights its role as a leading indicator of market trends and investor sentiment in the digital asset space.
Flight to Quality
The confidence of long-term holders in Bitcoin is bolstered by the decreasing availability of Bitcoin for trading and the rising interest from new participants, particularly from the traditional financial sector.
Data supports this narrative, especially in the context of recent geopolitical and macroeconomic uncertainties. Bitcoin’s evolving relationship with traditional assets is evident in its correlation patterns. As of November, Bitcoin’s 30-day correlation with gold averaged 72%, indicating similar price movements. However, the 90-day trend remained consistent (see figure 6).
Figure 6: Bitcoin and gold correlation
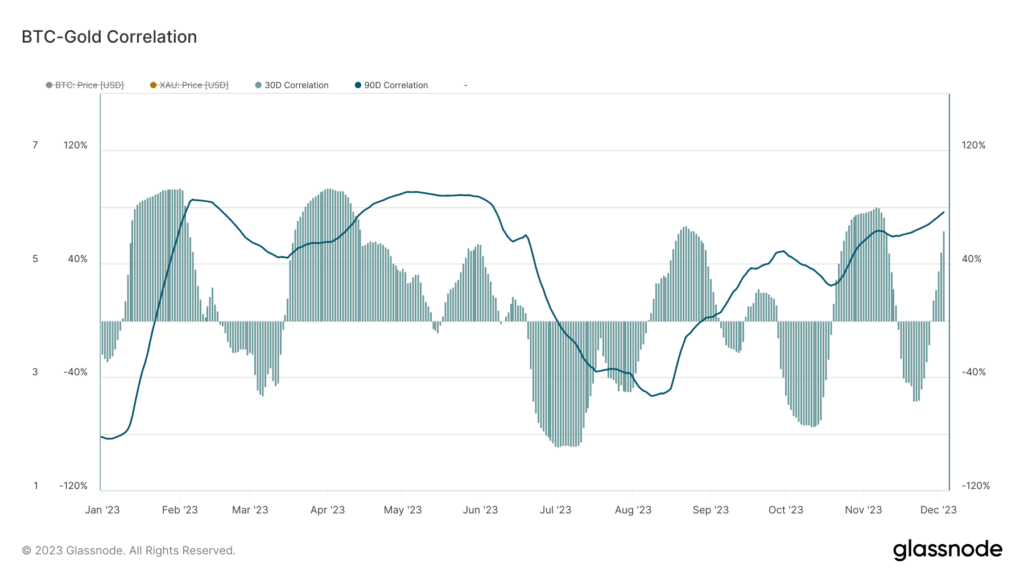
Contrastingly, Bitcoin shows negative correlation with equity indices like the S&P 500 and the Nasdaq Composite. This divergence highlights Bitcoin’s growing status as a diversifier and a hedge against volatility in traditional markets.
Amidst these market dynamics, there is heightened anticipation around the potential approval of a Spot BTC ETF in the US. It is expected to have significant implications for the cryptocurrency market. Such an approval could further integrate Bitcoin into mainstream financial markets, potentially attracting more institutional investors and solidifying its role as a credible and viable investment asset.
The comparison of Bitcoin (BTC) and Ethereum (ETH) prices in terms of gold offers a unique perspective on their performance relative to a traditional store of value. In 2023, BTC has appreciated significantly, up by 110% against gold, while ETH has also shown notable growth, rising 60% in gold terms (see figure 7). The robust performance of both cryptocurrencies, during a time of increasing global uncertainty, is likely attracting attention from traditional investors.
Figure 7: BTC and ETH relative performance versus gold
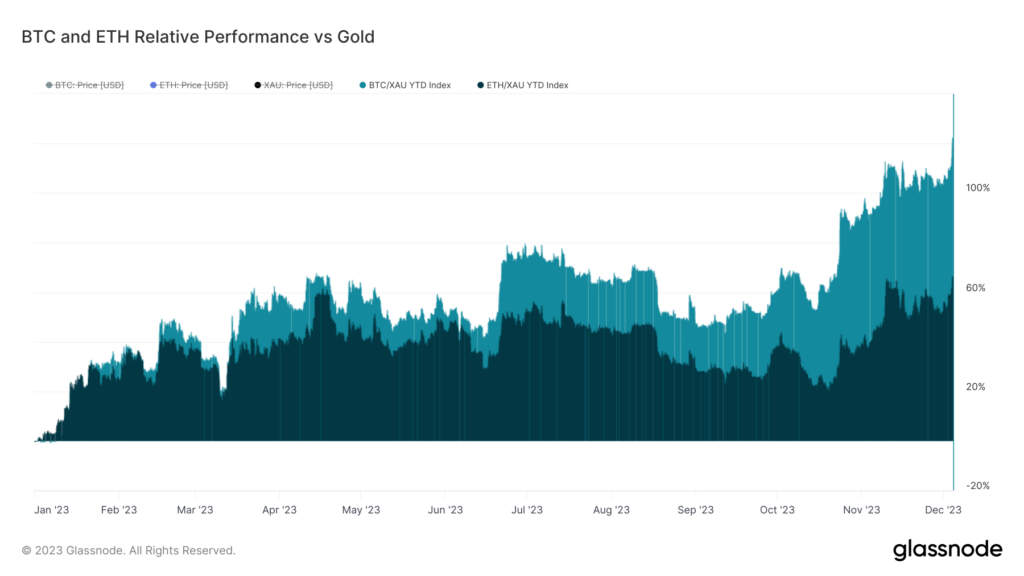
An analysis of the 30-day rolling returns for BTC and ETH throughout 2023 reveals a tight correlation in their performance. However, during market upswings, Bitcoin has consistently outperformed Ethereum. This suggests that while both cryptocurrencies move in tandem during downturns, Bitcoin tends to gain more relative value in periods of positive market momentum.
The Alt-season
Ethereum experienced the highest gas fees in six months, driven by increased network activity coinciding with a broader rise in cryptocurrency prices and trading volumes. A key contributor to this surge in gas usage has been the decentralized exchange Uniswap, particularly due to trading volumes of meme tokens such as GROK, as well as actively traded tokens like RLB and LINK.
Additionally, Telegram trading bots like Banana Gun, which offer a user-friendly interface for trading tokens directly on the Telegram platform, have also played a significant role in the increased consumption of gas on Ethereum. These bots, facilitate access to token trading and have contributed to the heightened activity and consequently, the higher gas fees observed on the Ethereum network. This trend reflects the growing diversity in how users interact with and utilize the Ethereum blockchain, extending beyond traditional exchanges to more accessible and varied platforms (see figure 8).
Figure 8: Development in gas fees
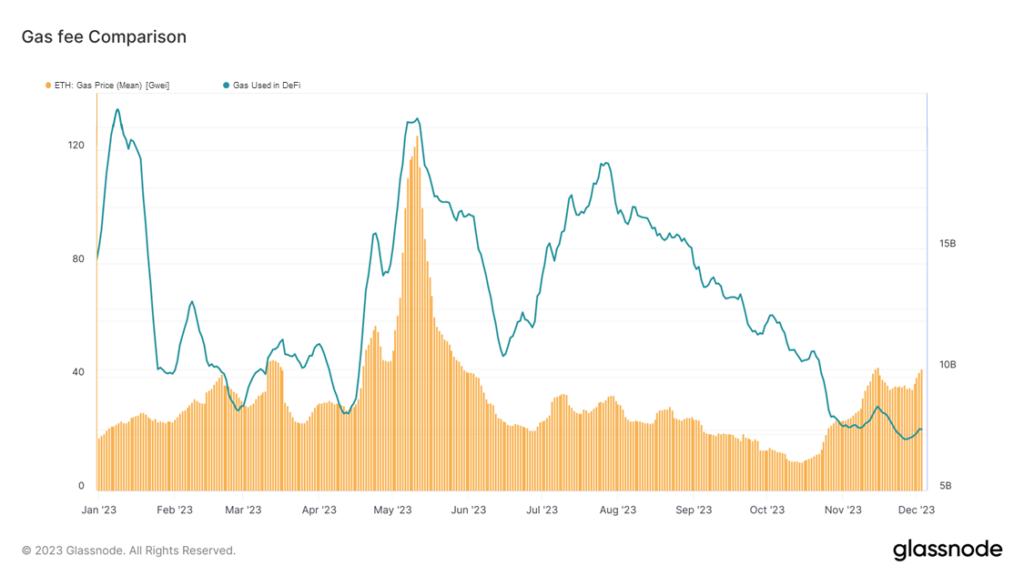
In an extended analysis of Ethereum’s gas fees, particularly in relation to decentralized finance (DeFi) activities, an interesting trend emerges. Historically, before the widespread availability of Layer 2 solutions, there was a direct correlation between gas fees and the amount of gas used in DeFi transactions on Ethereum. As gas usage in DeFi increased, so did the gas fees, moving almost in tandem.
However, with the introduction and adoption of various Layer 2 solutions, which offer lower transaction costs and higher scalability, this relationship has started to diverge as shown in figure 8. As more users shift to Layer 2 platforms for DeFi activities, the direct link between gas used in DeFi on Ethereum and the gas fees has become less pronounced. This shift indicates a contradiction to the previous trend, as users now have alternatives to avoid high gas fees while still participating in DeFi activities.
This trend highlights the impact of Layer 2 solutions in decentralizing and optimizing the Ethereum ecosystem. By providing more cost-effective options, these solutions are not only changing user behavior but also reshaping the dynamics of gas usage and fees on the Ethereum network.
Alt-season Indicator
The model developed by Glassnode offers a simple yet effective way to analyze ‘alt-season’ in the cryptocurrency market, a period characterized by capital rotation from major assets to alternative coins. According to historical trends, Bitcoin typically leads the market, followed by a flow of investment into Ethereum and then into higher-risk assets.
The model uses the 30-day change in the Realized Cap of Bitcoin (BTC) and Ethereum (ETH), along with the total supply of Stablecoins, to visualize this capital rotation. These changes are normalized as a percentage of the Realized Cap (for BTC and ETH) or total supply (for Stablecoins).
The model then defines a ‘risk-on’ environment a ‘risk-off’ environment as follows:
- Risk On: When all three assets show net capital inflows, and increase in Altcoin cap momentum (total crypto market cap excluding BTC, ETH and stablecoin)
- Risk-off: If any of the three major assets starts to exhibit net capital outflows.
An ‘Alt–season’ is identified within a primary uptrend when capital not only flows into all three major assets but also shows a positive and increasing trend in the ETH Realized Cap and Stablecoin Total Supply. This approach effectively captures the momentum in altcoins by monitoring the flow and dynamics of capital within the cryptocurrency market.
Figure 9: Altseason indicator according to Glassnode.
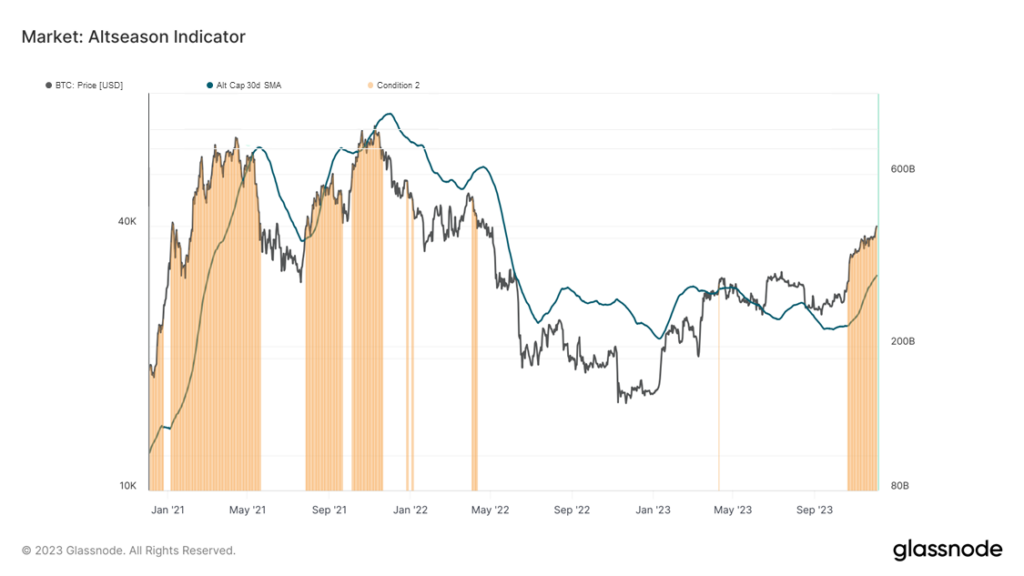
In figure 9, we look for periods where the aggregate valuation of the Altcoin sector is greater than its 30D simple moving average (SMA). Since 20th October this indicator is flashing positive, preceding the BTC jump from USD 29,500 to the current price of USD 41,000.
Conclusion
The year 2023 has marked a significant turnaround for the cryptocurrency market, with Bitcoin leading the charge. The easing of macroeconomic risks and the growing adoption and integration of digital assets in traditional financial portfolios have played crucial roles in this resurgence. Bitcoin’s dominance, evidenced by its substantial market cap growth and the increasing interest from institutional investors, highlights its status as a pivotal player in the market. Ethereum, while not matching Bitcoin’s growth, continues to play a vital role, especially in the realm of decentralized finance and network activity. The anticipation of regulatory developments, such as the potential approval of a Spot BTC ETF, further adds to the market’s maturity and appeal.
Overall, the digital asset market in 2023 has demonstrated resilience and growth, underlining its increasing significance in the broader financial landscape.