 AMINA Bank AG
  AMINA UK
  AMINA Hong Kong
  AMINA EU
 Executive Summary
Bitcoin set a new all-time high in October as the United States launched the first bitcoin ETFs. Its on-chain fundamentals have remained supportive, and the rally is poised to continue.
Alternative payment chains recorded a positive performance but underperformed Bitcoin. Contrary to Bitcoin, their fundamentals worsened.
Ethereum is the most used chain by a large margin, but its market share is eroding. Some users prefer competitive chains with lower transaction costs. Alternative platform chains’ performance was mixed in October. While Cardano performed poorly, Polkadot did very well. In November, Polkadot parachain auctions will begin and for Cardano, the ecosystem is being built.
Decentralised finance (DeFi) apps continue to underperform and are now trading at attractive valuations. Any trigger could potentially rerate the entire space.
Table 1: Price performance in USD of the assets in coverage universe as of 31 October 2021
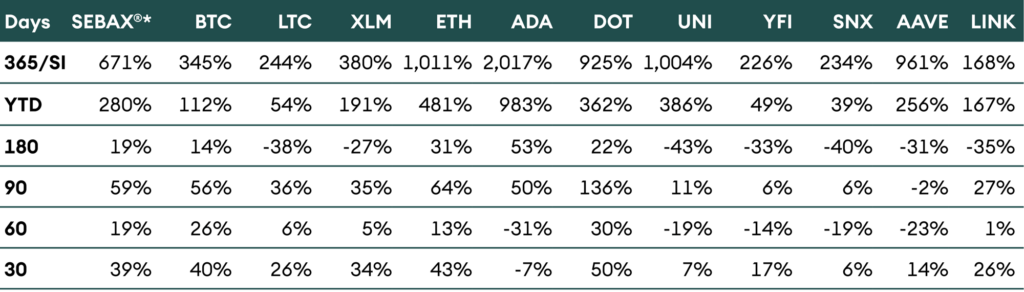
Source: AMINA Bank, Coinmetrics
Introduction
The market picked up momentum last month and reached new highs in October, and the total market capitalisation passed above USD 2.7 trillion for the first time. Bitcoin reached a new all-time high above USD 65,000, followed by Ether and Polkadot. The AMINAX® index, our proprietary large-cap index, also made a new record.
Table 1 summarises the performance of a selection of currencies. It shows Bitcoin primarily led the rally, as it moved up by 40% last month. Ether and Polkadot did even better as their price increased by 43% and 50%, respectively. It is worth noting that Cardano’s price (ADA) shrunk by 7%, and the DeFi sector (UNI, SNX, AAVE, YFI) continues to underperform.
Typically, bitcoin leads a new bull rally as it gains the market’s initial focus. Over the last month, its market dominance has increased from 43% to 48% mid-month, settling at 44% as the month ended and altcoins rallied. In the later stages of a bull cycle, alts benefit from a rotation out of bitcoin as new narratives gain steam.
Bitcoin
Bitcoin made its new all-time high (ATH) as the first bitcoin ETFs went live in the United States. Two ETFs were launched in October and have accumulated USD 1.27 billion assets under management. It is important to note that these ETFs are based on futures contracts on Chicago Mercantile Exchange, and as a result, pay a cost for rolling over the monthly contracts. We estimate this cost at 8-10% annually, making the products an expensive way to get exposure to bitcoin.
Grayscale has applied for a spot-based bitcoin ETF, but approval is not expected before Q2 2022. The Securities and Exchange Commission (SEC) approved the expensive futures-based ETF as it offers more control over the product as it trades on a regulated exchange. In addition, there is no custody risk to owning futures contracts as opposed to owning bitcoin directly.
With ETFs finally approved in the United States, a large part of the regulatory uncertainty discount is eroded today. In the foreseeable future, we expect the price to increase closer to the rhythm of adoption.
Against this background, it is insightful to watch the Lightning Network (LN) adoption. LN is a scalability solution that has gained traction after El Salvador made Bitcoin a legal tender. About USD 200 million worth of Bitcoin are locked in this network from a mere USD 30 million at the start of the year. This shows the increasing adoption of bitcoin as a medium-of-exchange in addition to its store-of-value attribute.
With the new all-time high set, the question is whether the cycle top is yet to come or already behind us. Cycle tops for bitcoin typically have been multiples of previous tops, not a marginal increase as has been the case so far. If we take history as our guide, we can expect the new cycle top to be further out.
Table 2: Historically, the price of bitcoin increased by an average of 867% between successive cycle tops
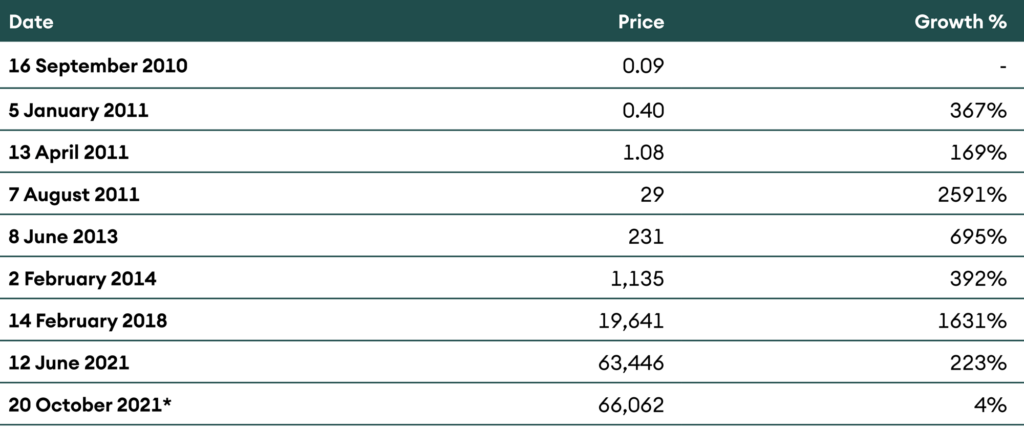
Source: AMINA Bank, Coinmetrics
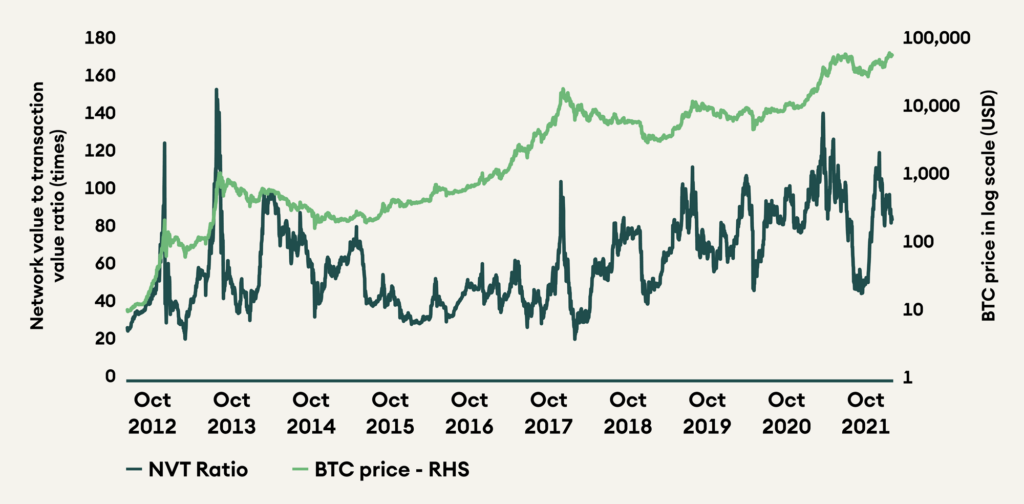
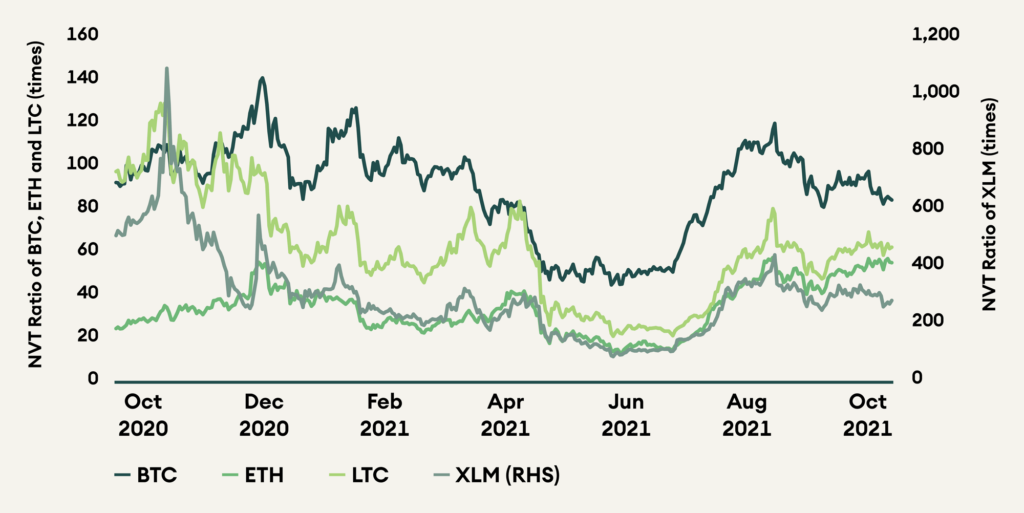
A fundamental indicator for bitcoin is the network value to transaction value ratio (NVT) that compares the market cap to the amount settled on-chain. This ratio measures the value of the chain with the utility it provides. Even as bitcoin set a new high, the NVT ratio remained broadly unchanged last month at 85 (see fig. 1). During previous cycle tops, the NVT ratio spiked significantly just days before the top was set. A middling NVT ratio indicates that the bitcoin’s valuation is not stretched.
Figure 1: Bitcoin’s NVT ratio has not yet spiked to previous levels of frothiness
On the other side of the network, the hash rate for bitcoin is recovering despite the share of Chinese miners falling to 0. Analysis from the University of Cambridge shows that the United States and Kazakhstan have benefited from the exodus of miners from China. From January to August 2021 (the latest data), the United States hash rate share has increased significantly from 13% to 35%, respectively.
Despite the massive fall in hash rate, the network has been resilient. It did not experience any downtime or security breach. In addition, the hash rate has doubled from the lows in July to 150 EHz/s showing intact support from the miner community.
Figure 2: The United States has increased its share of hash rate share after the Chinese ban on mining activities
Alternative Payment Chains
The payment coins, litecoin and lumen, participated in the rally but at a slower pace, closing up by 26% and 34% in October. However, unlike bitcoin, their NVT ratio deteriorated during the price rise, indicating that the network usage did not increase in line with the prices. Litecoin’s NVT ratio increased by 21% to 63, and lumen’s increased by 5% to 291. Ether’s NVT ratio also saw a sharp increase of 25% to 55, although it is still the lowest of the four.
Figure 3: NVT ratios of ether and litecoin increased significantly for the month
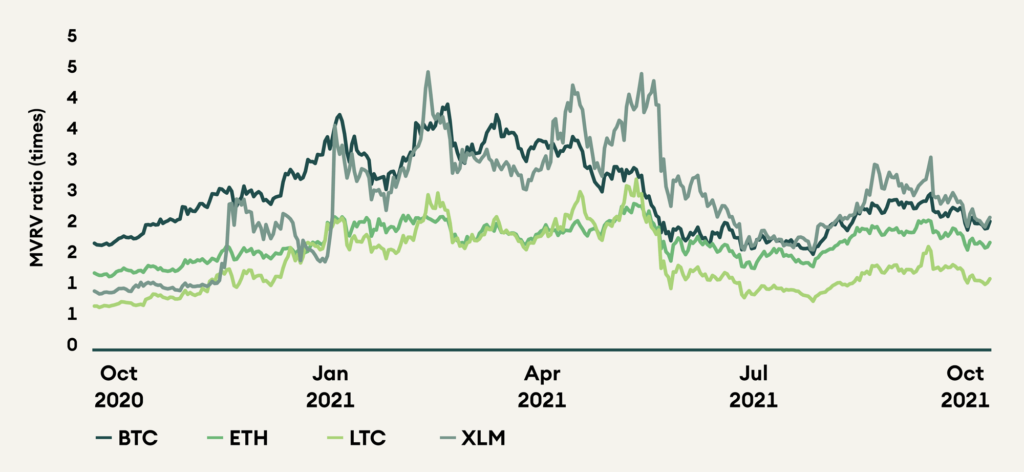
The behavioural indicator, market capitalisation to realised value (MVRV) ratio, measures the degree of profitability of holders. For October, the ratio deteriorated for all coins. Lumen has the highest MVRV ratio of 2.8 after it increased by 30% last month. It is followed by bitcoin with an MVRV ratio of 2.7, +29% in a month. Ether and litecoin have MVRV ratios of 2 and 1.4 and increased by 19% and 22%, respectively.
Figure 4: MVRV ratios of the coins increased for the month but are still significantly below their 1-year highs
Ethereum
Ether also hit a new all-time high above USD 4,500, keeping up with the pace set by bitcoin. Unlike bitcoin that is transitioning to a more mature asset with fewer catalysts and risks, ether is still a project under development. The next and probably the most important trigger is the development of new use-cases and the continued high usage of the blockchain. If we include stablecoins (USDC, USDT, and DAI) and wrapped assets (WETH and WBTC) in the calculation for value settled, the Ethereum network settled USD 28 billion per day in October, 50% more than that on Bitcoin at USD 18 billion.
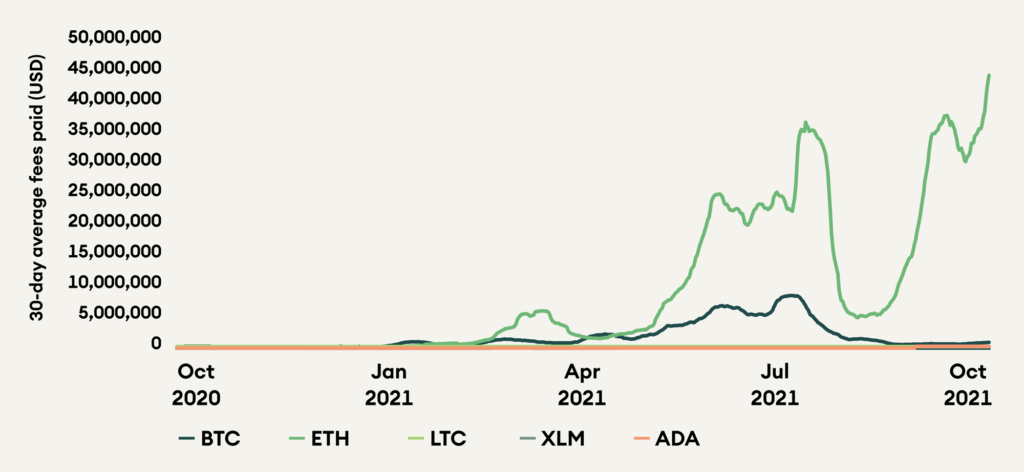
Another proxy for the usefulness of the blockchain is the fees paid by users. As users are willing to pay high transaction fees, it indicates that they expect to derive at least as much value from the blockchain. Average daily fees paid on Ethereum for October are USD 44 million, 49 times of fees on Bitcoin and 1,160 times of fees on Cardano.
Figure 5: Fees paid on Ethereum dwarves the fees on any other blockchain
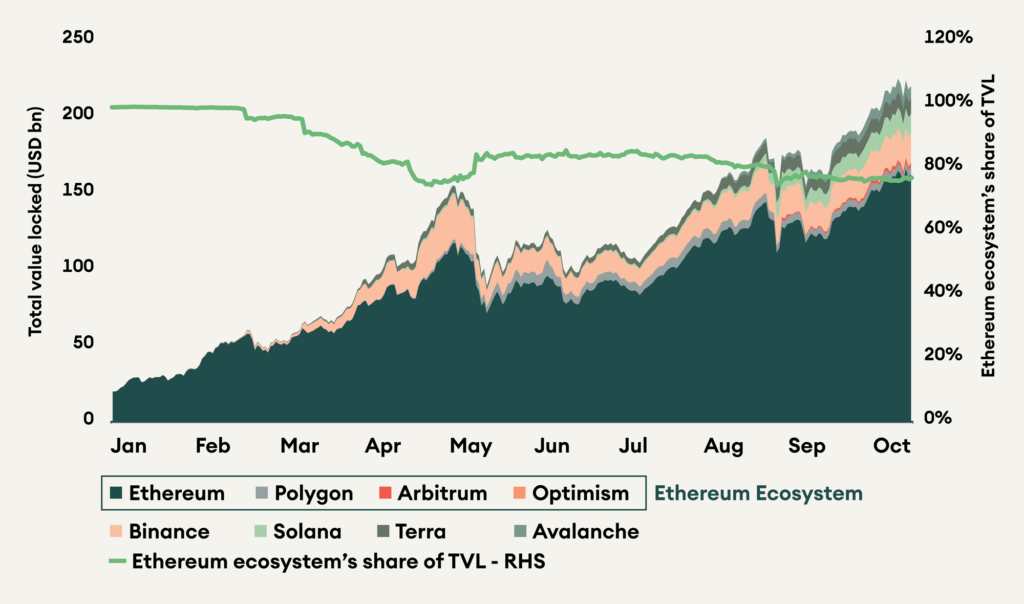
However, these high fees are also the reason why Ethereum has been losing market share to its competitors. The high competition in the smart contract space is one of the key risks for Ethereum. Ethereum is trying to compete through scaling solutions such as Polygon, Arbitrum and Optimism, which have 10 to 1,000 times lower fees, but are not yet mature products. Ethereum ecosystem’s share of total value locked (TVL) was slightly lower for October, closing at 77%, down from 78% in September.
Figure 6: Ethereum ecosystem’s share of TVL has fallen from 99% at the beginning of the year to 77%

Alternative Platform Chains
Alternative platform chains recorded mixed performance. Among them, Cardano was the worst performer for the month, whereas Polkadot was the best performer. Cardano set its all-time high in August, just before the launch of smart contracts on the chain in September. However, market participants were disappointed by the release of only prototype applications created by the development team at IOHK. The dapp ecosystem on Cardano is currently in the development phase, and exciting projects are coming up. Ardana – a DeFi hub, Charli3 – an oracle, and Singularity Net – a decentralised AI network, are some of the exciting projects to keep an eye on in the coming months.
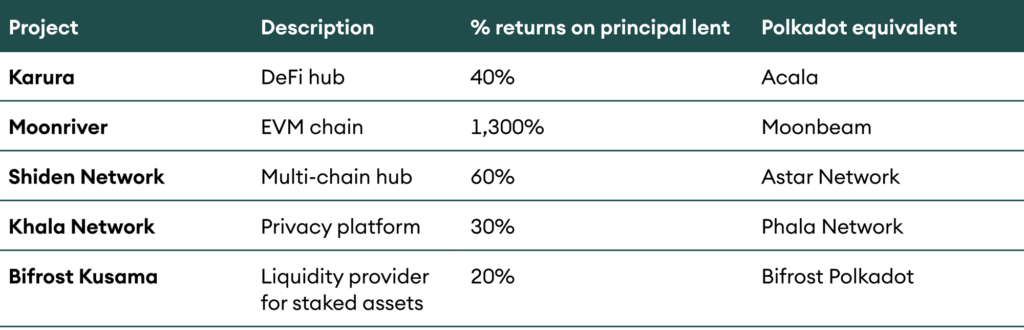
For Polkadot, parachain auctions are finally set to begin in November. Auctions on Kusama were successful, and all eyes are on Polkadot to replicate, if not exceed, the success of its canary network. Kusama parachain auctions have locked up 2.6 million KSM or 26% of the total supply in the 12 conducted so far. Polkadot will have 11 back-to-back weekly auctions, with the first one beginning on 11 November 2021 and the last one concluding on 10 March 2022.
Table 3: Handsome returns on Kusama crowdloans have investors excited for the upcoming ones on Polkadot
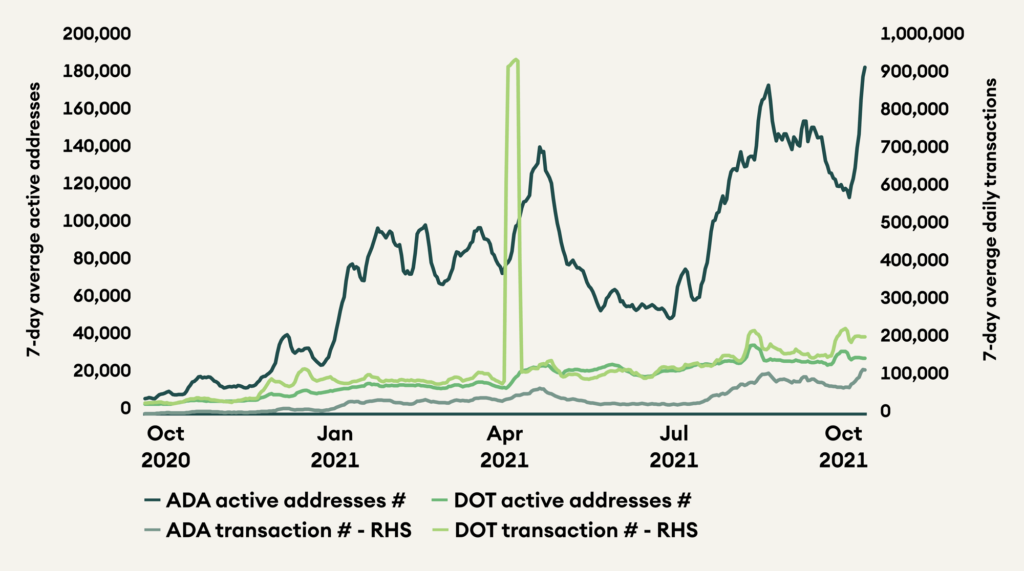
Polkadot transactions jumped by 29% as users unstaked their DOT to get ready for the parachain auctions. Polkadot recorded more than 200,000 transactions, almost double the number of Cardano transactions at 112,000. Active addresses on Cardano remain much higher than those on Polkadot. However, this number is inflated as Cardano uses an extended UTXO accounting model that creates a new address after every transaction.
Figure 7: Polkadot transactions increased in preparation for parachain auctions
Decentralised Finance
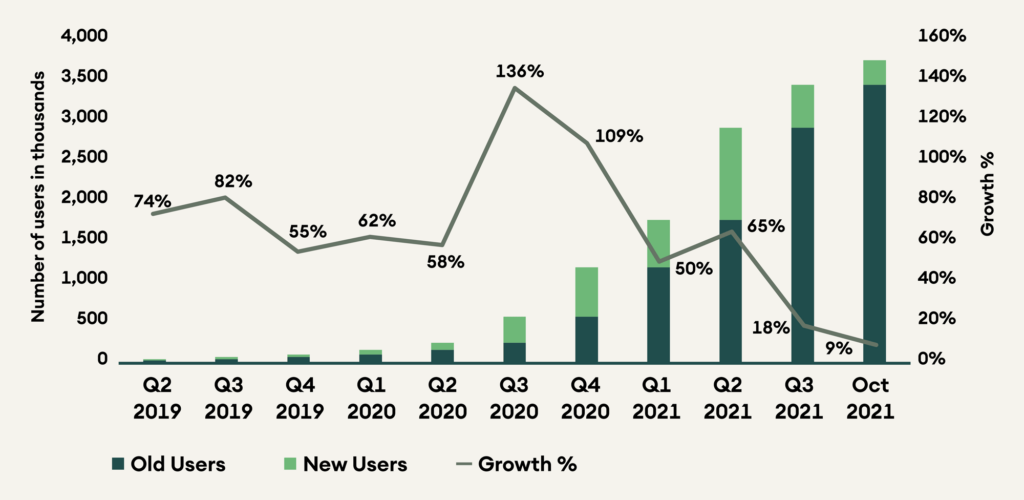
Decentralised finance (DeFi) has underperformed this year. High gas prices, change in the dominant narrative, and a regulatory overhang has depressed activity and compressed valuations. Ethereum DeFi apps added 535,000 users in Q3 2021, less than half of Q2 2021 at 1.1 million. Q4 has seen a slight uptick as the trending dog coins are primarily traded on decentralised exchanges like Uniswap.
Figure 8: DeFi user growth on Ethereum has fallen
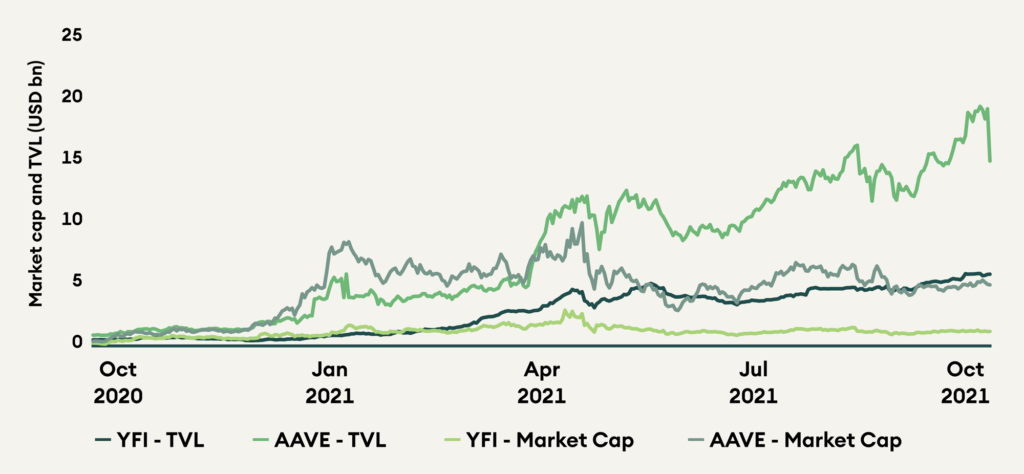
Even as price action has been weak, TVL for DeFi is at all-time highs and crossed the USD 100 billion milestone for the first time in October. TVLs are important as revenue for protocols like Aave, and Yearn Finance is directly linked to their TVLs. Even with TVLs at all-time highs, the price for these projects is far from it. The multiples at which these coins trade is severely depressed because of low user growth. YFI trades at a 1-year low market cap to TVL ratio of 0.21, much below the yearly average of 0.68. Aave trades at a market cap to TVL ratio of 0.33 at less than half its yearly average of 0.82. DeFi protocols are continuously innovating to bring back growth, as we discussed in the previous Digital Investor. Partnerships with institutional platforms and horizontal expansion through a multi-chain strategy may provide new avenues of growth and lead to a sector rerating.
Figure 9: Market cap for Aave and Yearn Finance has not kept pace with TVL growth
Cream Finance, a lending protocol and fork of Compound Finance, was exploited for USD 130 million on 27 October. Justin Sun, the founder of the smart contract platform, Tron withdrew USD 4.2 billion from Aave in various assets on 29 October as a preventive measure against a similar hack. However, Aave was able to take preventive measures in protecting itself and did not suffer the same fate.
Conclusion
October was an exciting month for the crypto markets, and the bull run seems to be back in full force. Continued momentum from the large-cap coins like bitcoin and ether, as they enter the virtuous cycle of new highs, greater hype, and more adoption should catapult the market to new highs.
Bitcoin looks more like a mature asset with limited catalysts left for considerable upsides. On the other hand, altcoins still have strong avenues for growth with newer use-cases and broader adoption to come. Smart contract platforms and DeFi projects led by strong teams will be able to capitalise on any upcoming engines for growth.