 AMINA Bank AG
 AMINA UK
  AMINA Hong Kong
  AMINA EU
Executive summary
Strategy, the company formerly known as MicroStrategy, has temporarily shifted from net bitcoin accumulation towards bitcoin monetisation, using BTC sales to fund preferred obligations and repurchase STRC below par. This is not improvisation. It is a board-authorised programme adopted on 29 June 2026, and the proximate cause is a preferred instrument rather than the bitcoin price.
Five things define the position:
- Strategy sold 6,948 bitcoin in 2026, with the reported sale prices below its company-wide average BTC cost basis, having sold none in either 2024 or 2025.
- The Q2 2026 filing states plainly that the proceeds funded preferred stock dividends.
- The Digital Credit Capital Framework of 29 June 2026 formalised bitcoin sales as a funding tool.
- STRC, the instrument that became the largest funding channel for Bitcoin purchases, has been repurchased at a rising price each week, from $86.53 to $95.20.
- Strategy redefined mNAV on 23 July and states that figures before and after that date are not comparable.
The company remains solvent, over-reserved and its bitcoin unencumbered. What has changed is the direction of travel and the basis on which this position is reported.
Why is Strategy selling bitcoin?
The immediate financing pressure behind Strategy’s bitcoin sales is STRC trading below its $100 stated amount. Once STRC fell below par, Strategy’s ability to use the instrument as a funding source was impaired. That made BTC monetisation and discounted STRC repurchases more attractive than issuing common equity while MSTR traded around or below the value of its underlying bitcoin exposure.
Bitcoin’s price is an important constraint, but STRC falling below par was therefore the key financing trigger. The distinction is between the underlying pressure and the financing event: BTC determines the value of the reserve and the economics of the capital structure, while STRC determines whether Strategy can continue using preferred shares to finance
Strategy at a glance
Figure 1 sets out what Strategy sold. The final column sets out what the money was for, and that is what makes 2026 different from anything in the company’s record.
Figure 1: Strategy bitcoin disposals in 2026
| Period | BTC sold | Gross proceeds | Average price | Stated use of proceeds |
|---|---|---|---|---|
| Q2 2026 | 1,395 | $83.2m | $59,663 | Preferred dividends |
| 1 to 24 July 2026 | 2,225 | $135.2m | $60,773 | Dividends, USD Reserve |
| 27 July to 2 August 2026 | 1,638 | $104.7m | $63,957 | Dividends, STRC repurchases |
| 3 to 9 August 2026 | 1,690 | $108.6m | $64,262 | STRC repurchases |
| 2026 total | 6,948 | $431.7m |
Source: SEC EDGAR, AMINA Bank.
Figure 2: Strategy capital structure scorecard, August 2026
| Metric | Reading |
|---|---|
| Bitcoin held | 840,447 BTC, acquired for $63.36bn at $75,385 average |
| Bitcoin reserve value | $54.02bn at a bitcoin price of $64,279 |
| USD Reserve | $4.80bn, roughly 2.7 years of fixed charges |
| Long-term debt, net carrying | $6.71bn at 30 June 2026, down 18 per cent from $8.19bn |
| Preferred notional | $15.24bn across five series |
| Annual interest and preferred dividends | Approximately $1.76bn |
| Consolidated operating cash flow, H1 2026 | $9.85m |
| mNAV, Strategy definition | 1.06 times |
| mNAV, conventional definition | About 0.71 times |
Source: Strategy free writing prospectus, 14 August 2026, 8-K of 17 August 2026, Figures are presented using the latest available disclosure for each metric: bitcoin holdings and USD Reserve as of 16 August 2026; bitcoin reserve value and mNAV as of 10 August 2026; debt as of 30 June 2026.
The footnote that changes the meaning of the sale
A sentence buried in footnote (e) of Strategy’s second-quarter 10-Q marks something the company had never before had reason to disclose: the proceeds from bitcoin sales during the quarter were used to fund dividend payments on preferred stock.
Strategy sold 1,395 bitcoin in the second quarter for $83.2 million, at an average of $59,663 per coin. It sold at a loss and used the proceeds to pay its preferred holders. The roll-forward carries a further detail. Those 1,395 bitcoin had an original cost basis of $168.1 million, or roughly $120,500 per coin, against a company-wide average of $75,578. Strategy did not sell an average coin. It selected its highest-cost lots, creating an approximately $84.9 million gap between the lots’ original cost basis and the sale proceeds.
The 2025 annual report states that no digital assets were sold in either 2024 or 2025. Strategy had sold bitcoin once before, disposing of 704 bitcoin on 22 December 2022 for $11.8 million and buying 810 back two days later. That transaction was a tax-loss sale that left holdings higher within 48 hours. The lot selection in Q2 2026 points to a similar tax mechanic. The important difference is what happened next. The 2026 disposals became a recurring source of funding for corporate obligations rather than a short-term tax transaction that was quickly reversed by a larger purchase. Strategy’s subsequent disclosures explicitly state that bitcoin-sale proceeds were used to fund preferred-stock distributions and replenish the USD reserve used for that purpose.
The timing deserves care. Strategy’s bitcoin holdings continued to rise through the second quarter:
Figure 3: Strategy’s Bitcoin Holdings Continued to Rise Through Q2 2026
| Date | Bitcoin holdings |
|---|---|
| 31 Dec 2024 | 447,470 BTC |
| 30 Sep 2025 | 640,031 BTC |
| 31 Dec 2025 | 672,500 BTC |
| 31 Mar 2026 | 762,099 BTC |
| 30 Jun 2026 | 846,000 BTC |
Source: Strategy company disclosures, SEC filings; AMINA Bank
Strategy bought roughly 85,296 bitcoin during the second quarter while selling approximately 1,395, meaning disposals amounted to less than 2% of quarterly purchases. The significance is therefore not that Strategy suddenly stopped buying bitcoin in Q2. The Q2 disposal was immaterial relative to its purchases.
The more important shift came afterwards. Sales continued into Q3, became recurring and were incorporated into the company’s capital allocation framework. By early July, Strategy had announced a BTC Monetization Program allowing it to sell bitcoin to generate additional proceeds for its USD Reserve, while its disclosures continued to identify preferred-stock distributions as a use of bitcoin-sale proceeds.
The meaningful reversal is therefore a third-quarter event, not a second-quarter one.
The framework made selling a policy
On 29 June 2026, Strategy’s board adopted the Digital Credit Capital Framework. It established a USD Reserve with a twelve-month minimum coverage requirement against fixed obligations, revised the STRC dividend rate policy, created a $1.0bn Digital Credit Securities Repurchase Program and a $1.0bn Class-A common repurchase authorisation, and launched a BTC Monetization Program permitting bitcoin sales for reserve building, obligation funding and buyback funding
Then came a new metric set: Net Reserve, Net Bitcoin Per Share, Amplification, and BTC Hurdle, Breakeven, and Floor annualised returns. This has attracted the least commentary and deserves the most. These are not accumulation metrics. They are leverage and capital structure metrics. Strategy has reframed its product from simply owning more bitcoin per share towards managing amplified exposure to a smaller net base, currently 1.47 times. The distinction matters because the old Strategy model maximised BTC accumulation per share, while the new framework explicitly manages the relationship between BTC exposure, senior claims, reserves and the cost of capital.
The company has not abandoned bitcoin. It has changed what it sells to investors.
STRC is the real subject, not bitcoin
STRC, the Variable Rate Series A Perpetual Stretch Preferred Stock, exists to trade at $100. Strategy states that it sets the monthly dividend rate in such manner as it believes is designed to cause STRC to trade at or close to its stated amount. It became the single largest funding channel for bitcoin purchases.
The Q2 2026 10-Q discloses that STRC sales funded $2.06bn of first-quarter purchases and $5.46bn of second-quarter purchases, $7.52bn in total, against $6.15bn of Class A common-stock proceeds used for bitcoin purchases over the same six months.
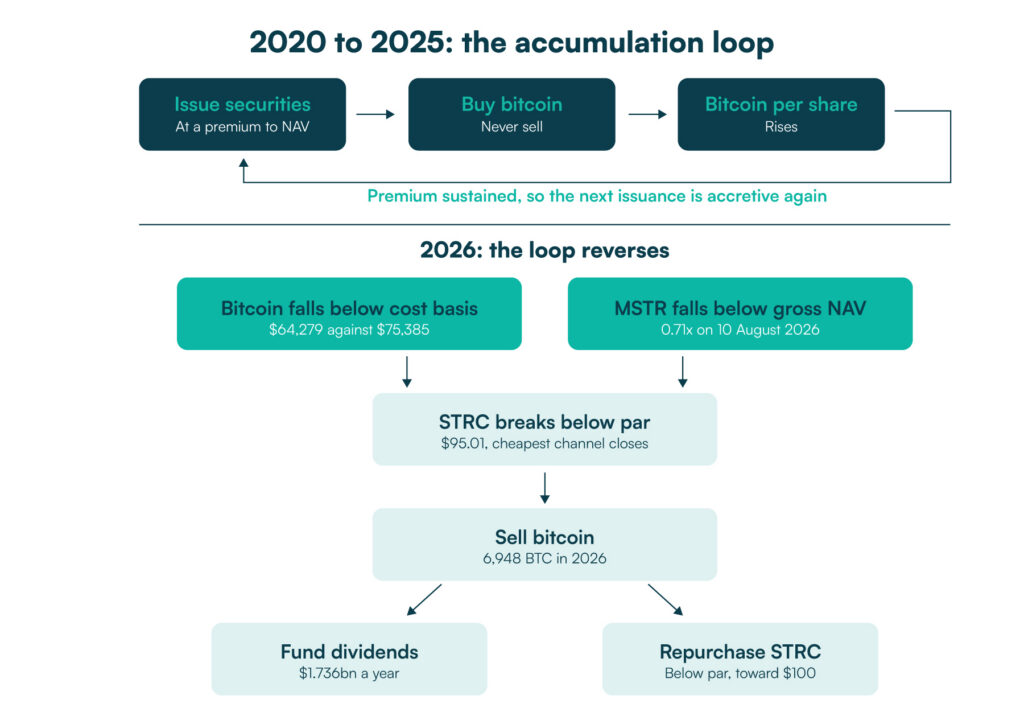
Then it broke. STRC fell below par in late May 2026 and closed at $95.01 on 7 August 2026. Strategy has said it will not issue STRC below $100, so for that entire period the channel was shut.
That left two expensive options. The first was to issue common equity at roughly 0.71 times gross bitcoin net asset value. That would raise capital, but at the expense of common shareholders because new equity would be issued below the value of the company’s gross bitcoin holdings.
The second was to sell bitcoin at around $64,000 and use the proceeds to retire STRC below par. This reduces the BTC reserve, but it also extinguishes $100 of stated preferred value for roughly $93 and permanently removes the associated dividend obligation.
The choice is therefore not simply “sell BTC or issue equity”. It is a relative-value decision between two forms of dilution: reducing the bitcoin reserve versus issuing common equity below gross bitcoin net asset value.
Figure 4: STRC repurchases, derived from weekly 8-K disclosures
| Week ending | Shares repurchased | Cash paid | Implied average price |
|---|---|---|---|
| 26 July 2026 | 288,930 | $25.0m | $86.53 |
| 2 August 2026 | 912,143 | $81.2m | $89.02 |
| 9 August 2026 | 1,152,020 | $108.6m | $94.27 |
| 16 August 2026 | 1,388,720 | $132.2m | $95.20 |
| Programme to date | 3,741,813 | $347.0m | $92.74 |
Source: Strategy Current Reports on Form 8-K filed 27 July, 3 August, 10 August and 17 August 2026, AMINA Bank calculations
Two things follow. STRC’s price is rising each week, as the framework is designed to achieve. Strategy has retired $374.2m of STRC stated amount for $347.0m of cash, capturing $27.2m of discount. At a 12% dividend rate, this also removes roughly $44.9m of annual preferred dividend expense, with STRC outstanding falling to approximately 102.5 million shares from 104.9 million at 30 June.
The pressure this relieves is arithmetic. Annual interest and preferred dividends total approximately $1.76bn, against just $9.85m of operating cash flow in H1 2026. Strategy itself says its software operations are not expected to generate sufficient cash to meet its liquidity needs. That gap is why the framework exists.
Figure 5: Strategy’s funding loop, before and after 2026
Source: AMINA Bank
Can the funding loop restart?
The intended sequence is now legible:
Sell modest quantities of bitcoin → fund preferred obligations → repurchase STRC below par → restore STRC towards par → reopen the preferred funding channel → resume BTC accumulation.
Chief Executive Phong Le has indicated that Strategy intends to resume bitcoin purchases before the end of 2026, while Michael Saylor has floated early September as an informal target for STRC to return to par. Both are management commentary rather than filed guidance.
There is early evidence in the company’s favour. Strategy’s 8-K filed on 17 August reports that it sold no bitcoin in the week to 16 August, the first such week since selling resumed in May. During the same week, it funded $52.4m of STRC dividends and $132.2m of STRC repurchases from $333.7m of net proceeds raised through its common-stock at-the-market programme, while adding $149.1m to the USD Reserve.
Figure 6: Strategy’s USD Reserve Has Rebuilt Rapidly Since Q2
| Date | USD Reserve | Implied coverage* |
|---|---|---|
| 30 Jun 2026 | $2.40bn | 16 months |
| 24 Jul 2026 | $3.75bn | 26 months |
| 2 Aug 2026 | $4.00bn | — |
| 9 Aug 2026 | $4.65bn | — |
| 16 Aug 2026 | $4.80bn | ~33 months |
Based on approximately $1.76bn of annual interest and preferred dividend obligations. Strategy’s stated policy minimum is 12 months.
Source: Strategy company disclosures, SEC filings; AMINA Bank analysis.
The pause in bitcoin sales is therefore encouraging, but it is not yet proof that the old accumulation model has returned. The critical test is whether STRC can sustainably return to par and whether Strategy can reopen the preferred funding channel without relying on recurring BTC sales.
The measurement changed at the same moment
On 23 July 2026 Strategy redefined mNAV. Its free writing prospectus dated 14 August states that references to mNAV calculated before that date are not comparable to mNAV calculated after it.
The revised definition is share price divided by Net Bitcoin Per Share, where the denominator deducts out-of-the-money debt and preferred notional and adds back the USD Reserve. On the 10 August snapshot, Strategy reported an mNAV of 1.06 times, based on Net Bitcoin Per Share of $92.11 and a share price of $97.33. On the same date, the conventional measure of market capitalisation divided by gross bitcoin value was approximately 0.71 times, based on $38.37bn of market capitalisation against $54.02bn of bitcoin holdings.
Both numbers are accurate and answer different questions. The conventional measure compares the market value of Strategy’s equity with the gross value of its bitcoin reserve. Strategy’s revised framework instead incorporates senior claims and the USD Reserve into its measure of common equity exposure. The important investment question is therefore not which definition is “correct”, but whether the valuation premium that historically supported Strategy’s equity-funded accumulation model has disappeared.
On the August 2026 peer-comparison basis used in this analysis, Strategy’s mNAV is approximately 1.00 times. At that level, the substantial valuation premium that historically supported the accumulation flywheel has largely disappeared. This does not by itself imply that MSTR is overvalued or undervalued. It means the equity valuation no longer provides the same cushion that previously allowed Strategy to issue common stock at a premium to its underlying bitcoin exposure.
The change matters because of where the older measure had already travelled. On the conventional basis, MSTR has traded below gross bitcoin net asset value since around the end of 2025, ranging between roughly 0.59 and 1.05 times through 2026, against the 1.64 times we published in June 2025 on the same definition. The redefinition therefore arrives at a point where the conventional valuation framework had stopped providing the same support for the accumulation case.
Five mechanisms that could break the plan
1. The preferred rate ratchet
STRC was issued at 9.00 per cent in July 2025, raised to 10.00 per cent for the month ended 30 September, 10.25 per cent from 1 October, 10.50 per cent from 1 November, and onward to 12.00 per cent from 1 July 2026. At $95.01 the effective yield is 12.63 per cent and par is still not restored. Each increase raises fixed charges, which raises the BTC Hurdle return the common equity must clear, currently 10.77 per cent. The mechanism is therefore asymmetric: the rate can rise quickly as STRC trades below par, but the path back down is constrained by the reset formula.
2. Reflexivity in the funding mix
When common equity is issued at an unattractive valuation to fund preferred obligations, value can transfer from common shareholders towards the credit stack. Strategy’s own BTC Yield ran 25.9 per cent for the nine months to 30 September 2025 and 22.8 per cent for the 2025 financial year, against 4.5 per cent year to date in 2026. The implication is straightforward: the capital structure works best when the return generated by additional BTC exposure exceeds the cost of the capital used to acquire it. When that relationship weakens, the same leverage that amplified upside can amplify the cost of maintaining the structure.
3. The convertible put ladder
Convertible debt fell from $8.19bn at 31 December 2025 to $6.71bn net carrying at 30 June 2026, after Strategy repurchased and cancelled $1.5bn principal of the 2029 notes on 19 May 2026 for $1.38bn, booking a $113.9m extinguishment gain. What remains is a ladder of non-contingent holder put rights at par. At a share price near $97, the conversion options are deeply out of the money, making the holder put dates more relevant than the stated maturity dates.
Figure 7: Convertible holder put ladder
| Put date | Series | Principal | Conversion price |
|---|---|---|---|
| 15 September 2027 | 2028 notes | $1.01bn | $183.19 |
| 1 March 2028 | 2030B notes | $2.00bn | $433.43 |
| 1 June 2028 | 2029 notes | $1.50bn | $672.40 |
| 15 September 2028 | 2030A and 2031 notes | $1.40bn | $149.77 and $232.72 |
| 15 June 2029 | 2032 notes | $0.80bn | $204.33 |
Source: Strategy Q2 2026 Form 10-Q, Note 6 and the Maturities and Holder Repurchase Rights table, AMINA Bank
Stated maturities are not the binding dates. The first real one is 15 September 2027.
4. Index deletion and the ATM feedback loop
MSCI declined in January 2026 to exclude digital asset treasury companies specifically but froze their share-count increases. On 14 August it opened a broader consultation proposing that non-operating companies become ineligible for its Global Investable Market Indexes, using an asset-agnostic test. Applied to May 2026 data, the screen would delete Strategy. Feedback closes 30 September, results are due 16 October, and implementation would follow at the November review.
Estimates of forced passive selling run to roughly $1.8bn to $2.0bn. The mechanism matters more than the estimate: index deletion could pressure the share price, which would weaken the economics of the at-the-market programme at a time when it is carrying an increasing share of Strategy’s funding burden.
5. Structural bitcoin monetisation
The most important unresolved question is whether Strategy’s BTC monetisation programme is a temporary bridge or a permanent feature of the treasury model. Strategy has signalled digital credit sales equivalent to 10 to 20 per cent of the bitcoin reserve annually, which at current levels is $5.4bn to $10.8bn a year.
If BTC sales remain a temporary bridge while STRC returns to par, the current disposals can be interpreted as capital structure optimisation. Strategy would be sacrificing a limited amount of BTC to repair a funding channel that can then support renewed accumulation.
If, however, Strategy begins selling bitcoin equivalent to 10 to 20 per cent of its bitcoin reserve annually regardless of STRC’s trading level, the strategy has changed more fundamentally. Investors would no longer be underwriting perpetual BTC accumulation. They would be underwriting leveraged BTC exposure combined with recurring treasury monetisation.
That distinction is not yet answerable from the filings. It is therefore one of the most important variables to monitor through the remainder of 2026.
What is not happening
Reserve coverage is roughly 2.7 years against a twelve-month policy minimum. Bitcoin at $54.02bn covers $6.75bn of debt notional and $15.24bn of preferred notional by about 2.4 times. Since the redemption of the 2028 secured notes on 26 September 2024, all Strategy debt has been senior unsecured with no maintenance covenants and no margin triggers, so no collateral mechanism exists to force a sale.
The corporate alternative minimum tax exposure, a live concern through 2025, was resolved by Treasury and Internal Revenue Service interim guidance on 30 September 2025 permitting unrealised digital asset gains and losses to be disregarded in adjusted financial statement income. S&P Global Ratings assigned a B- corporate credit rating on 27 October 2025 and affirmed it in December 2025, with no subsequent action found.
Strategy also retains a release valve it has not used. STRD, at roughly $1.40bn notional and a 10 per cent rate, is the only non-cumulative series in the stack, so an undeclared dividend on it does not accrue. Skipping STRD would be the first unambiguous distress signal in this structure, and it has not happened.
Strategy is institutionalising a broader treasury-company shift
Strategy is not operating in isolation.
MARA Holdings provides the clearest comparable example. Between 4 and 25 March 2026, MARA sold 15,133 bitcoin for approximately $1.1bn and used the proceeds alongside other capital to repurchase roughly $1.0bn of convertible notes at a discount, capturing around $88.1m in cash savings.
Sequans provides another example of treasury assets being used to manage the capital structure. Its 2026 disclosures show that the company sold 700 bitcoin and redeemed $50.8m of convertible debt. Other digital asset treasury companies have also used their reserves for capital management rather than treating accumulation as the only objective.
Semler Scientific is no longer a standalone comparable because Strive completed its acquisition on 16 January 2026.
On August 2026 estimates, Nakamoto trades at roughly 1.04 times mNAV, Strategy at 1.00 times, BitMine at 0.96 times and SharpLink at 0.77 times. Strategy therefore remains valued close to the underlying value of its bitcoin exposure, but the substantial premium that historically supported its accumulation model has largely disappeared.
The significance is less that Strategy is trading below its peers and more that the valuation cushion that once allowed it to issue equity above the value of its bitcoin holdings is no longer present.
The broader point is that digital asset treasury companies are increasingly using their crypto reserves as capital management assets rather than treating accumulation as the only objective. Strategy has institutionalised this behaviour earlier, at larger scale and with a formal board framework, but it has not escaped the valuation pressure affecting the sector.
Outlook to year end 2026
The remainder of 2026 is likely to be determined by whether Strategy can restore the economics of its preferred funding channel before bitcoin monetisation becomes structural.
Base case. STRC returns towards par, bitcoin sales stop, the preferred funding channel reopens and Strategy resumes net bitcoin accumulation. In this scenario, the recent BTC sales function primarily as a bridge between two financing regimes rather than as a permanent change in treasury strategy.
Bull case. STRC returns to or above par, the dividend rate stabilises, MSTR’s valuation improves and the at-the-market programme becomes an efficient source of capital again. Strategy can then resume BTC accumulation without relying materially on recurring BTC sales.
Bear case. STRC remains below par, preferred funding costs continue rising, MSTR remains around or below NAV and BTC sales become recurring. In that scenario, the monetisation programme would cease to look like a bridge and begin to look like a permanent component of the capital structure.
Four indicators should determine which scenario is emerging.
- First, STRC needs to hold par so the preferred funding channel can reopen and bitcoin sales stop being necessary.
- Second, the STRC dividend rate needs to stabilise, because every increase raises the hurdle the common equity must clear. T
- hird, MSCI needs to leave Strategy in its indices on 16 October, or the resulting share-price pressure could impair the at-the-market programme at exactly the moment it is carrying a larger share of the funding burden.
- Fourth, Strategy needs to resume net accumulation before the market concludes that the monetisation programme is a run rate rather than a bridge.
All four should surface in the weekly 8-K filings well before they appear in a quarterly report. The pause in bitcoin sales after 16 August is therefore encouraging, but it is not yet conclusive. The key question is whether it becomes a pattern.
Frequently asked questions
Q. Is Strategy selling bitcoin?
Yes. Strategy disclosed four bitcoin disposals in 2026 totalling 6,948 BTC for approximately $431.7m gross, having sold none in either 2024 or 2025. Its Q2 2026 Form 10-Q states the proceeds funded preferred stock dividends. It sold no bitcoin in the week to 16 August 2026.
Q. Why is Strategy selling bitcoin if it is a bitcoin treasury company?
The reason is that the STRC preferred stock fell below its $100 stated amount, closing the company’s largest funding channel. Selling bitcoin to retire STRC below par is cheaper than issuing common equity at a discount to net asset value, and it reduces the dividend obligation permanently.
Q. What is Strategy’s mNAV in 2026?
About 1.06 times on Strategy’s own definition as of 10 August 2026, and about 0.71 times on the conventional market capitalisation to gross bitcoin measure on the same date. Strategy redefined the metric on 23 July 2026 and states that figures before and after that date are not comparable.
Q. When are Strategy’s convertible notes due?
The binding dates are holder put dates, not stated maturities. The first is 15 September 2027 for $1.01bn of 2028 notes, followed by $2.0bn in March 2028, $1.5bn in June 2028, $1.4bn in September 2028 and $0.8bn in June 2029.
Q. Is Strategy at risk of bankruptcy?
There is no evidence for that on current disclosure. Reserve coverage is roughly 2.7 years against a twelve-month policy minimum, bitcoin covers senior claims by about 2.4 times, and all debt is senior unsecured with no margin triggers.
Disclaimer, Research and Educational Content
This document has been prepared by AMINA Bank AG (“AMINA”). AMINA is a Swiss licensed bank and securities dealer with its head office and legal domicile in Switzerland. It is authorised and regulated by the Swiss Financial Market Supervisory Authority (“FINMA”).
This document is published solely for educational purposes; it is not an advertisement nor a solicitation or an offer to buy or sell any financial investment or to participate in any particular investment strategy. This document is for publication only on AMINA website, blog, and AMINA social media accounts as permitted by applicable law. It is not directed to, or intended for distribution to or use by, any person or entity who is a citizen or resident of or located in any locality, state, country or other jurisdiction where such distribution, publication, availability or use would be contrary to law or regulation or would subject AMINA to any registration or licensing requirement within such jurisdiction.
Research will initiate, update and cease coverage solely at the discretion of AMINA. This document is based on various sources, incl. AMINA ones. In preparing this document, AMINA may have made limited use of artificial intelligence enabled tools to assist with research, summarisation, and drafting, with all content subject to human review and validation.
No representation or warranty, either express or implied, is provided in relation to the accuracy, completeness or reliability of the information contained in this document, except with respect to information concerning AMINA. The information is not intended to be a complete statement or summary of the subjects alluded to in the document, whereas general information, financial investments, markets or developments. AMINA does not undertake to update or keep current information. Any statements contained in this document attributed to a third party represent AMINA’s interpretation of the data, information and/or opinions provided by that third party either publicly or through a subscription service, and such use and interpretation have not been reviewed by the third party.
Any formulas, equations, or prices stated in this document are for informational or explanatory purposes only and do not represent valuations for individual investments. There is no representation that any transaction can or could have been affected at those formulas, equations, or prices, and any formula(s), equation(s), or price(s) do not necessarily reflect AMINA’s internal books and records or theoretical model based valuations and may be based on certain assumptions. Different assumptions by AMINA or any other source may yield substantially different results.
Nothing in this document constitutes a representation that any investment strategy or investment is suitable or appropriate to an investor’s individual circumstances or otherwise constitutes a personal recommendation. Investments involve risks, and investors should exercise prudence and their own judgment in making their investment decisions. Financial investments described in the document may not be eligible for sale in all jurisdictions or to certain categories of investors. Certain services and products are subject to legal restrictions and cannot be offered on an unrestricted basis to certain investors. Recipients are therefore asked to consult the restrictions relating to investments, products or services for further information. Furthermore, recipients may consult their legal/tax advisors should they require any clarifications.
At any time, investment decisions (including, among others, deposit, buy, sell or hold investments) made by AMINA and its employees may differ from or be contrary to the opinions expressed in AMINA research publications.
This document may not be reproduced, or copies circulated without prior authority of AMINA. Unless otherwise agreed in writing, AMINA expressly prohibits the distribution and transfer of this document to third parties for any reason. AMINA accepts no liability whatsoever for any claims or lawsuits from any third parties arising from the use or distribution of this document.
©2026 AMINA, Kolinplatz 15, 6300 Zug