 AMINA Bank AG

 AMINA UK
 AMINA Hong Kong
 AMINA EU

Executive summary
On 22 October 2026, US technology stocks recorded their sharpest decline in months as investors reassessed the economics of artificial intelligence investment. The Nasdaq Composite fell 2.58%, the S&P 500 declined 1.19%, and the Philadelphia Semiconductor Index extended its decline to approximately 25% from its June peak. However, the Dow Jones Industrial Average finished marginally higher, suggesting a rotation away from technology rather than indiscriminate selling across equities.
The sell-off coincided with Brent crude rising above USD 114 per barrel amid escalating Middle East tensions. US unemployment claims remained near multidecade lows, complicating expectations for Federal Reserve monetary easing. Meanwhile, Bitcoin’s reversal from nearly USD 85,000 exposed the sensitivity of leveraged crypto positions to changes in global risk appetite.
Three observations emerge from market developments:
- Recent market reactions indicate that AI trade is shifting from growth expectations to capital efficiency. Investors are increasingly questioning how quickly rising infrastructure expenditure will translate into cash flow, even if companies continue to report earnings above expectations.
- Higher energy prices and resilient employment are limiting monetary policy flexibility. The combination raises the possibility that interest rates will remain restrictive even as equity valuations decline.
- Crypto remains exposed to global liquidity and positioning. Bitcoin’s price movements increasingly reflect portfolio allocation, leverage and macroeconomic expectations alongside crypto-specific developments.
What triggered the sell-off?
The 22 October sell-off exposed a shift in how investors are valuing the AI investment cycle: the market is appearing to indicate less willingness to reward infrastructure spending on the expectation of future growth alone, but increasingly questioning whether that growth can generate sufficient returns to justify the capital committed.
Quarterly results from Meta Platforms and Tesla brought these concerns into focus, triggering selling across technology stocks and semiconductor manufacturers. The Nasdaq Composite declined 2.58% to 26,008, its steepest daily fall since June, while the S&P 500 lost 1.19% to 7,664. In contrast, the Dow Jones Industrial Average gained 0.03%, suggesting a rotation away from technology rather than a broad withdrawal from US equities.
Chart: 24-hour sector performance of US equities (22nd October)
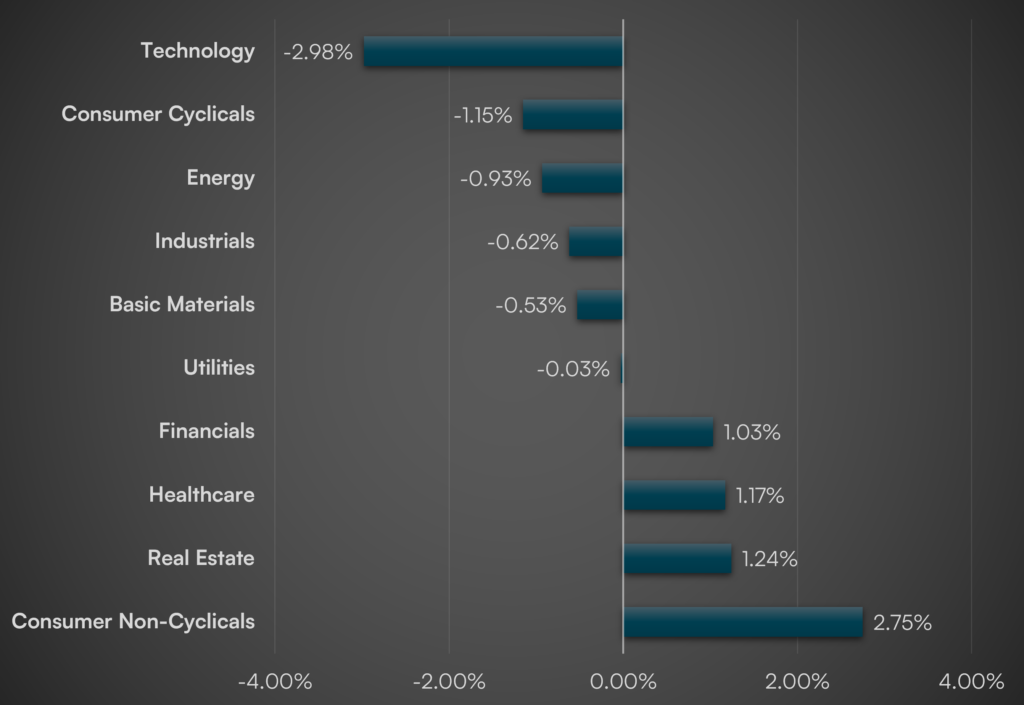
Source: Reuters
Sectoral performance reinforces this distinction. The 5.73-percentage-point gap between technology and consumer non-cyclicals indicates that investors appear to be favoring sectors with more predictable near-term earnings over those whose valuations depend heavily on future growth. This rotation occurred despite resilient corporate results: according to LSEG data cited by Reuters, 83% of the 111 S&P 500 companies that had reported third-quarter earnings exceeded analyst expectations. Investors are therefore reassessing the price of future growth rather than responding to a widespread deterioration in current earnings.
Meta illustrates the change in sentiment. Despite exceeding earnings expectations, the company raised the lower end of its 2026 capital expenditure guidance from USD 130 billion to USD 135 billion, retaining an upper limit of USD 145 billion. It also reported negative third-quarter free cash flow of USD 2.12 billion, its first quarterly deficit since 2012. Its shares fell more than 7% as investors questioned how rising infrastructure expenditure would affect future cash generation. (Meta)
Tesla faced similar selling pressure despite reporting positive free cash flow and reducing its planned 2026 capital expenditure by 20%, from USD 25 billion to USD 20 billion (tesla). The market reaction to both companies suggests that investors are scrutinising capital allocation decisions more closely, regardless of whether companies increase or reduce spending.
The underlying concern is the mismatch between the timing of investment and returns. AI infrastructure requires substantial upfront expenditure on semiconductors, data centres, networking equipment and energy supply, while revenues may materialise over several years. Financing costs, depreciation and operating expenses begin much earlier. A company can therefore report strong revenue growth while generating limited or negative free cash flow, particularly during periods of rapid infrastructure expansion.
The implications extend across the AI supply chain. Nvidia declined approximately 4% on 22 October, while semiconductor equipment manufacturer Lam Research fell around 10–12%, indicating that the repricing was already underway before the latest earnings announcements. These losses reflect concerns about the sustainability of hyperscaler spending, which supports revenues across semiconductor manufacturing, data-centre construction, utilities and infrastructure services.
This dependence creates a second-order risk. One company’s capital expenditure may be another company’s revenue, meaning a reduction in hyperscaler investment could weaken demand across multiple industries. Suppliers that have expanded capacity in anticipation of sustained AI infrastructure spending may face lower utilisation and earnings pressure if customers delay projects. The consequences could be greater for businesses that financed expansion on assumptions of continued demand growth and favourable borrowing conditions.
Evidence of this risk is emerging in credit markets. Meta’s five-year credit default swap (CDS) spread widened by 7.6 basis points to a record 114.79 basis points, indicating that investors were demanding greater compensation for exposure to its credit risk. During the same session, Blackstone identified widening spreads on AI-related debt as a potential opportunity, while the Financial Times reported selling pressure in bonds linked to data-centre projects. Although these developments do not establish widespread credit stress, they suggest that the reassessment of AI investment is extending beyond equity valuations into financing markets.
Competition from Chinese AI developers adds another dimension to the reassessment of US technology valuations. Models developed by DeepSeek, Alibaba’s Qwen, Moonshot AI and Z.ai are challenging the assumption that competitive AI capabilities require spending at the scale of US technology companies.
According to Moody’s, the six largest US hyperscalers are expected to spend more than USD 785 billion on capital expenditure in 2026, compared with approximately USD 140 billion by leading Chinese technology companies. Although these figures cover broader infrastructure investment rather than model development alone, the spending gap raises questions about the returns on US investment as lower-cost alternatives gain adoption.
Macros less supportive of immediate recovery
The technology sell-off coincided with renewed pressure in energy markets, adding an inflationary risk at a time when investors were already reassessing the economics of AI infrastructure investment. On 22 October, Brent crude rose 4% to settle at USD 113.17 per barrel, its highest closing level since May, while West Texas Intermediate (WTI) gained 2.4% to USD 99.47. The increase followed renewed Houthi attacks on Saudi Arabian infrastructure, raising concerns about energy production and transportation across the Middle East. Saudi Aramco evacuated staff from its headquarters in Dhahran, while the US ordered some diplomatic personnel and their families to leave Saudi Arabia.
The increase is notable because regional oil exports have been recovering. According to Morgan Stanley estimates, Middle Eastern crude exports reached approximately 17 million barrels per day in the preceding week, compared with an average of 18 million barrels per day in the 12 months before the Iran war. The recovery in physical supply, alongside rising prices, suggests that traders are pricing the risk of future disruptions rather than responding solely to an immediate shortage of crude. Attacks on Saudi infrastructure and threats to shipping through the Strait of Hormuz and Bab el-Mandeb could affect tanker availability, insurance premiums and transportation costs, even without a prolonged reduction in production. The geopolitical risk premium embedded in oil prices therefore reflects uncertainty over the reliability of future supply as much as current export volumes.
However, an oil supply shock differs from a conventional demand-driven slowdown. During a slowdown, weaker consumption typically reduces energy demand and inflationary pressure, creating room for monetary easing. A supply shock can sometimes raise prices while weakening growth. Higher crude prices increase transportation and manufacturing costs, reduce household purchasing power and force businesses either to absorb higher expenses through narrower margins or pass them on to consumers. The effects are uneven: energy-importing economies face higher import bills, while some producers and refiners benefit from stronger prices or margins. In the US, Valero Energy reported record quarterly profits as disruptions associated with conflicts in Iran and Ukraine supported refining margins, illustrating how the same shock can produce different outcomes across industries.
The implications also extend to the AI investment cycle. Data centres require substantial electricity for computing and cooling, making long-term power availability and pricing important determinants of infrastructure profitability. Although oil is not a major direct source of electricity for most US data centres, prolonged geopolitical disruption can influence natural gas markets, power procurement and broader infrastructure costs. Hyperscalers therefore face two sources of uncertainty: whether their computing capacity will generate sufficient revenue and whether the energy required to operate it can be secured at a competitive cost. Higher operating expenses may further reduce expected returns on projects already facing scrutiny over capital expenditure.
For the Federal Reserve, the energy shock is emerging alongside a labour market that continues to show limited layoffs but weaker hiring. Initial unemployment claims fell by 6,000 to 194,000 in the week ended 17 October, below economists’ expectations of 200,000 and near their lowest levels since 1969.
This creates a monetary policy dilemma. Low layoffs reduce the immediate need to support employment through lower interest rates, while higher energy prices increase the risk of persistent inflation. At the same time, weak hiring suggests that labour-market conditions may be less robust than initial claims alone indicate. Following the Federal Reserve’s September rate increase to a target range of 3.75–4.00%, market expects rates to remain unchanged at the 27–28 October meeting, with another increase possible in December. For growth-oriented companies, the prospect of restrictive interest rates raises the discount rate applied to future earnings and may reduce the present value of investments whose returns are expected several years ahead.
Financial-market movements on 22 October, however, revealed a more complicated picture. While oil prices rose and technology shares declined, investors increased their exposure to US government bonds. The 10-year Treasury yield fell below 5%, while the two-year yield recorded its largest one-day decline in more than a year, according to the Wall Street Journal.
Falling Treasury yields may appear inconsistent with concerns about persistent inflation, but bond markets respond to several forces simultaneously, including expected policy rates, growth prospects, inflation expectations and demand for liquid, relatively safe assets. The divergence between government bond yields and corporate financing conditions is particularly important. A decline in Treasury yields does not necessarily translate into lower borrowing costs for companies.
Corporate debt is priced at a spread over benchmark government yields, reflecting investors’ assessment of credit and liquidity risks. If Treasury yields decline while corporate spreads widen by a greater amount, companies may still face higher financing costs. The widening of Meta’s five-year credit default swap spread to 114.79 basis points illustrates why investors may examine credit-risk pricing alongside movements in government bond yields.
For AI infrastructure, this distinction has direct implications. Data centres and related projects require long-term financing, and their profitability depends partly on the difference between expected operating returns and the cost of capital. Lower Treasury yields could provide some relief, but that benefit may be offset if lenders demand higher premiums for exposure to capital-intensive technology projects. Consequently, the market could experience falling government bond yields and tighter financing conditions simultaneously.
Crypto markets: Bitcoin appears to hold up, but liquidity remains thin
The technology-led sell-off also weighed on cryptocurrency markets, reversing Bitcoin’s recovery towards USD 85,000. According to CoinGecko, Bitcoin traded around USD 81,875 at the beginning of the week before briefly approaching USD 85,000 and subsequently fell towards USD 81,000 on 22 October. The reversal indicates that Bitcoin remains sensitive to changes in global risk appetite, particularly as higher energy prices and uncertainty over US monetary policy weigh on growth-oriented assets.
Selling pressure extended across the broader crypto market. On 22 October, Bitcoin declined approximately 3.2%, while Ethereum fell 3.4%, Solana 3.0% and XRP 4.1%. By early 23 October, total cryptocurrency market capitalisation had fallen to approximately USD 2.74 trillion, a 5.6% decline over 24 hours, while Bitcoin dominance stood near 59.5%.
Crypto-related equities, including Strategy, Coinbase, Circle and listed miners, also came under pressure as technology shares weakened. The divergence between Bitcoin and the broader market indicates that investors were reducing exposure to more volatile digital assets, rather than treating cryptocurrencies as a defensive alternative to technology equities.
Despite Bitcoin’s relative strength, trading activity also weakened. Bitcoin had spent 28 consecutive days trading within the range established on 21 September, while its 28-day realized volatility declined towards the lowest levels of 2026. This subdued trading environment with the consolidation observed echoes of Bitcoin’s 2023 recovery, although the historical comparison does not establish that another rally will follow.
ETF flows provide a mixed picture. US spot Bitcoin ETFs recorded approximately USD 1078 million in net inflows over the period 19 -21st October, reversing USD 229 million in withdrawals during the preceding week and bringing 30-day net inflows to USD 1.63 billion. However, the Coinbase Bitcoin premium remained negative at approximately 0.10%, indicating that Bitcoin traded at a discount on Coinbase relative to Binance. This suggests that US spot demand remained subdued despite positive ETF flows.
Derivatives activity presents a contrasting picture. While spot trading volumes declined, aggregate futures volume increased. Bitcoin futures open interest rose 6% to USD 47.9 billion, with funding rates averaging approximately 5.4% annualised, indicating a modest preference for long positions. The divergence between declining spot activity and rising futures exposure suggests that leveraged trading is accounting for a greater share of market participation. This increases the potential for liquidation-driven price movements, particularly when spot liquidity is limited.
Volatility indicators also reveal a distinction between Bitcoin and traditional equities. The VIX increased 21% during the preceding Friday’s equity sell-off, while Bitcoin’s implied volatility on Hyperliquid remained comparatively stable. Nevertheless, Bitcoin’s 30-day correlation with the Nasdaq remained elevated at approximately 0.6, indicating continued sensitivity to broader equity-market movements. The relative stability of Bitcoin’s implied volatility should therefore not be interpreted as evidence of sustained decoupling from traditional financial markets.
Another development is the growing use of crypto derivatives platforms to trade traditional financial assets. Perpetual futures linked to gold, oil and equities generated approximately USD 55.3 billion in trading volume, an increase of 26.2% over the last week and equivalent to 60.3% of Bitcoin perpetual futures volume. This reflects the expanding role of crypto-native trading infrastructure in providing leveraged exposure to traditional markets, particularly during periods of heightened geopolitical and macroeconomic uncertainty. As trading activity increasingly spans cryptocurrencies, commodities and equities on the same platforms, developments in traditional financial markets may have a more direct influence on positioning and liquidity across digital asset derivatives markets.
Outlook
The coming weeks may bring further volatility as markets navigate monetary policy uncertainty and the US midterm elections. Investors are anticipating on the probability to the Federal Reserve leaving rates unchanged at its 27–28 October meeting, shifting attention to the possibility of another rate increase in December. With oil prices elevated and hiring slowing, the Fed’s guidance could prove more consequential for markets than the immediate rate decision.
The 3 November midterms add a second source of uncertainty. A change in congressional control may affect scrutiny of AI infrastructure investment and the direction of crypto market-structure legislation.
Together, the Fed’s policy guidance and the election outcome could impact volatility across equities, bonds and cryptocurrencies. For Bitcoin, where spot liquidity remains thin and derivatives positioning has increased, shifts in interest-rate expectations or broader risk appetite may produce large
price movements, as seen historically.
Disclaimer, Research and Educational Content
This document has been prepared by AMINA Bank AG (“AMINA”). AMINA is a Swiss licensed bank and securities dealer with its head office and legal domicile in Switzerland. It is authorised and regulated by the Swiss Financial Market Supervisory Authority (“FINMA”).
This document is published solely for educational purposes; it is not an advertisement nor a solicitation or an offer to buy or sell any financial investment or to participate in any particular investment strategy. This document is for publication only on AMINA website, blog, and AMINA social media accounts as permitted by applicable law. It is not directed to, or intended for distribution to or use by, any person or entity who is a citizen or resident of or located in any locality, state, country or other jurisdiction where such distribution, publication, availability or use would be contrary to law or regulation or would subject AMINA to any registration or licensing requirement within such jurisdiction.
Research will initiate, update and cease coverage solely at the discretion of AMINA. This document is based on various sources, incl. AMINA ones. In preparing this document, AMINA may have made limited use of artificial intelligence enabled tools to assist with research, summarisation, and drafting, with all content subject to human review and validation.
No representation or warranty, either express or implied, is provided in relation to the accuracy, completeness or reliability of the information contained in this document, except with respect to information concerning AMINA. The information is not intended to be a complete statement or summary of the subjects alluded to in the document, whereas general information, financial investments, markets or developments. AMINA does not undertake to update or keep current information. Any statements contained in this document attributed to a third party represent AMINA’s interpretation of the data, information and/or opinions provided by that third party either publicly or through a subscription service, and such use and interpretation have not been reviewed by the third party.
Any formulas, equations, or prices stated in this document are for informational or explanatory purposes only and do not represent valuations for individual investments. There is no representation that any transaction can or could have been affected at those formulas, equations, or prices, and any formula(s), equation(s), or price(s) do not necessarily reflect AMINA’s internal books and records or theoretical model based valuations and may be based on certain assumptions. Different assumptions by AMINA or any other source may yield substantially different results.
Nothing in this document constitutes a representation that any investment strategy or investment is suitable or appropriate to an investor’s individual circumstances or otherwise constitutes a personal recommendation. Investments involve risks, and investors should exercise prudence and their own judgment in making their investment decisions. Financial investments described in the document may not be eligible for sale in all jurisdictions or to certain categories of investors. Certain services and products are subject to legal restrictions and cannot be offered on an unrestricted basis to certain investors. Recipients are therefore asked to consult the restrictions relating to investments, products or services for further information. Furthermore, recipients may consult their legal/tax advisors should they require any clarifications.
At any time, investment decisions (including, among others, deposit, buy, sell or hold investments) made by AMINA and its employees may differ from or be contrary to the opinions expressed in AMINA research publications.
This document may not be reproduced, or copies circulated without prior authority of AMINA. Unless otherwise agreed in writing, AMINA expressly prohibits the distribution and transfer of this document to third parties for any reason. AMINA accepts no liability whatsoever for any claims or lawsuits from any third parties arising from the use or distribution of this document.
©2026 AMINA, Kolinplatz 15, 6300 Zug